Expanded home guarantee fuelling first home buyer surge, supports price gains


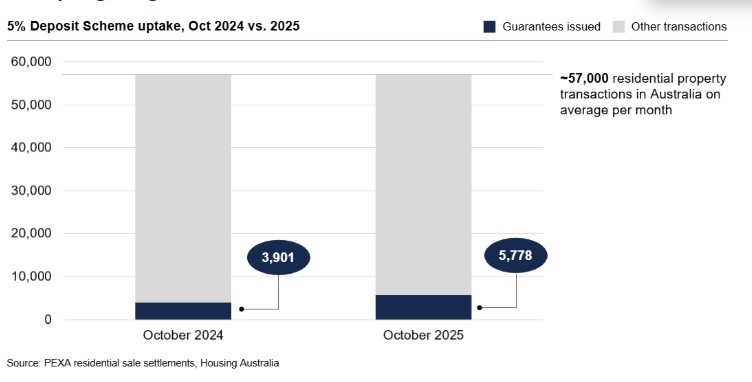
In the first month of the expanded 5% Deposit Scheme, 5,778 guarantees were issued, according to "background" figures released by Labor.
This compared to 3,901 government guarantees in October the previous year.
Although there is no official data as yet on the volume of home sales in October, last month's guarantees would account for more than 10% of the 57,000 average monthly home sales in Australia.
Since 1 October, the median purchase price under the scheme is $710,000.
This compares with the national median home value of $872,000, according to the latest Cotality data, indicating participants in the scheme are buying at the lower end of national markets.
It's the first data released after the expansion of the federal government's guarantee scheme to provide access to more first home buyers.
From 1 October, the rebadged 5% Deposit Scheme removed participation caps as well as scrapped income limits for first home buyer eligibility (previously capped at $125,000 for individuals and $200,000 for couples).
It also lifted price caps on eligible properties to better reflect home values around the country.
See also: Expanded Home Guarantee Scheme to kick off in October
Is the 5% Deposit Scheme blowing up home prices?
In the month before the start date, the country's peak real estate buyers body warned of a "frenzy" of buyer activity that was already driving up prices.
Critics of the expanded scheme had long claimed it would only serve to add further heat to Australia's residential property market.
Even property analysts who said the changes would be a "game-changer" for young people struggling to save a deposit warned that expanded access would come with its downsides.
There was more than a fair share of 'told you so's this week after new Cotality data showed national home values in October had seen their strongest monthly gain in more than two years.
But Labor's 'background' information also pointed out the uptake of guarantees was in line with Treasury estimates.
Treasury officials had said they expected around 70,000 guarantees to be issued over the first 12 months of the expanded scheme, around 20,000 more than under the previous program.
The 5,778 guarantees issued in October is almost bang on with a monthly average of around 5,800.
It was these numbers that "informed" Treasury's estimate that the expansion of the scheme will have a 0.6% price impact on house prices after six years.
It is far too early to gauge the accuracy of that forecast.
So, what drove up home prices in October?
As Cotality noted its latest Home Value Index data, there are "a lot of moving parts" currently influencing the housing market, underscored by the big one - persistently low levels of supply and above-average levels of demand.
Early participants in the expanded scheme with their paperwork in order may have played some role in increased first home buyer activity.
Perhaps some of the 5,778 buyers may have been holding fire from previous months to take full advantage of new eligibility parameters.
It remains to be seen how November's figure will compare.
October is also the middle of the peak Spring selling season where both home sale volumes and prices have been historically higher.
At the same time, investor lending is at near historical highs, with demand from that segment likely having some effect on home prices.
See also: Investor home loans narrow rates gap
Overall, those buying under the government guarantee remain a relatively small segment of all residential property transactions - for the first month at least.
Regardless, federal minister for Housing Clare O'Neil is unrepentant.
"We know that people are doing it really tough when it comes to housing so I'm really happy that 5,778 first homes were bought with support from the Albanese government in October," she said.
"This means more people paying off their own mortgage and not someone else's.
"We made a promise to first home buyers that we would help them and that's exactly what we're doing."
Advertisement
Buying a home or looking to refinance? The table below features home loans with some of the lowest interest rates on the market for owner occupiers.
| Lender | Home Loan | Interest Rate | Comparison Rate* | Monthly Repayment | Repayment type | Rate Type | Offset | Redraw | Ongoing Fees | Upfront Fees | Max LVR | Lump Sum Repayment | Extra Repayments | Split Loan Option | Tags | Features | Link | Compare | Promoted Product | Disclosure |
|---|---|---|---|---|---|---|---|---|---|---|---|---|---|---|---|---|---|---|---|---|
6.19% p.a. | 6.23% p.a. | $3,059 | Principal & Interest | Variable | $0 | $530 | 90% |
| Promoted | Disclosure | ||||||||||
5.89% p.a. | 5.80% p.a. | $2,962 | Principal & Interest | Variable | $0 | $0 | 80% |
| Promoted | Disclosure | ||||||||||
5.99% p.a. | 5.95% p.a. | $2,995 | Principal & Interest | Fixed | $0 | $0 | 60% |
| ||||||||||||
6.23% p.a. | 6.23% p.a. | $3,072 | Principal & Interest | Variable | $0 | $395 | 70% | Disclosure |