
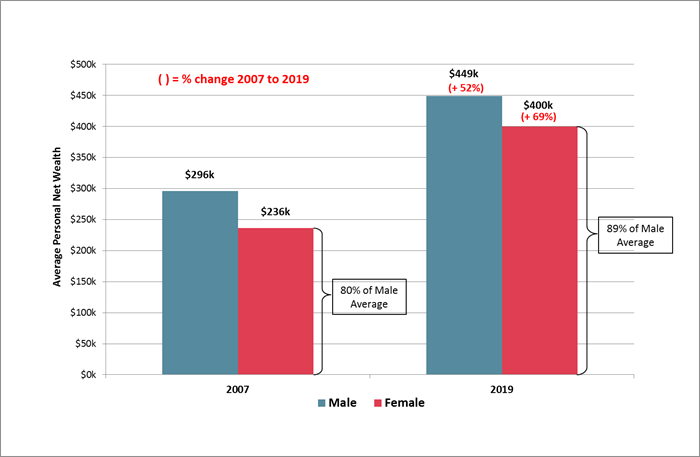
The second edition of the Roy Morgan Wealth Report found the average net wealth (personal assets minus debt) per capita of females in Australia in the year to March 2019 was $400,000, equal to 89% of the male average of $449,000.
Prior to the global financial crisis in 2007, the average female’s net wealth was only $236,000, or 80% of the $296,000 male average.
In this time the average woman saw a 69% increase in net wealth, a considerably larger margin than the 59% male increase from $296,000 to $449,000.
Roy Morgan’s report also found the average net wealth per capita of Australians has increased by 59.7%, from $285,600 in 2007 to $424,200 in 2019.
When allowing for inflation, this is an increase of 23.8%.
Personal Net Wealth Gender Comparison – 2007 v 2019
Source: Roy Morgan Single Source (Australia).
Roy Morgan CEO Michele Levine said there are several driving factors that have contributed to the diminished pay gap.
“A major contributing factor towards the closing of the wealth gap for females appears to be their increased participation in the workforce which has gone from 56.4% in 2007 to 61.9% in 2019,” Ms Levine said.
“Also the value of owner-occupied homes in a rapidly rising market, when jointly owned, is a contributing factor to closing the gender gap, as both sexes are gaining equally from what is generally the household’s biggest asset.”
Ms Levine also commented that the study was a more well-rounded way of reviewing the finances of Australians.
“A great deal of coverage and public comment is focused on income and superannuation inequality between the genders but what we have looked at here is a more holistic view of each gender’s average financial position,” she said.
“Net wealth has been used here as a more relevant single measure of economic circumstances incorporating all assets, including superannuation and subtracting debt.”
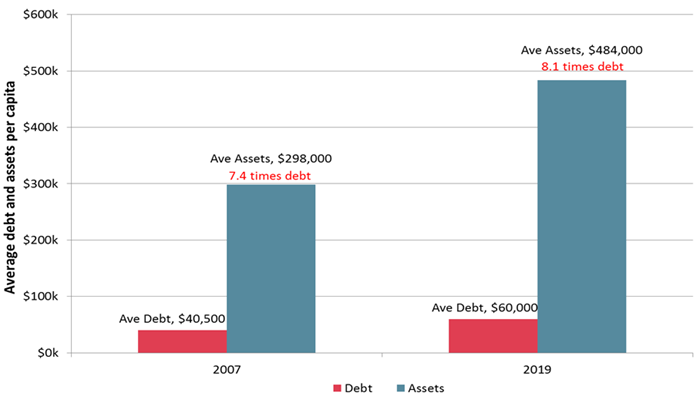
Asset values almost double
Research released in July from the same report found the value of assets held by Australians is up 96.0% from 2007 to 2019.
This is faster than the increase in debt of 78.6% over the same period.
Roughly half of Australia’s personal wealth continues to be held in the form of owner-occupied housing (49.8%), down slightly from 51.6% in 2007.
Superannuation assets make up an increasingly higher portion, rising from 19.2% to 24.4% of our wealth since 2007.
Source: Roy Morgan Single Source (Australia).
Ms Levine said although the last 12 months have seen a marginal decline in household net worth, the long term trend is very positive.
“Housing debt has grown considerably since 2007, but not uniformly – Roy Morgan’s data shows wealthier cohorts have shown a much greater propensity to take on debt and those investors have more ability to handle downturns than more marginal borrowers in lower-wealth segments,” she said.
“A more detailed understanding of how debt and personal wealth are distributed can help dispel some of the more simplistic fears over debt, and give a more balanced view of its relationship to wealth creation in Australia over the long term.”
The Roy Morgan Wealth Report is drawn from over half a million in-depth face to face interviews in Australian homes, covering the period from 2007 to 2019.
