The Federal Chamber of Automotive Industries (FCAI) tallied a total of 1,062,867 new vehicles sold in 2019.
This figure marks the lowest annual car sales figure - reported by automotive stats service VFACTS - since 2011.
FCAI chief Tony Weber said economic conditions in Australia and globally affected the disappointing results.
"2019 reflects a tough year for the Australian economy, with challenges including tightening of lending, movements in exchange rates, slow wages growth, and of course, the extreme environmental factors our country is facing," Mr Weber said.
On a monthly basis, 84,239 new vehicle sales were recorded for December 2019 - a decrease of 3.8 per cent compared to December 2018.
The car sales winners and losers
2019 saw a further shift to SUV sales, which now hold 45.5 per cent of the total market - a 2.5 per cent increase from 2018.
However, overall sales of SUVs declined in 2019 by 2.4 per cent compared to 2018.
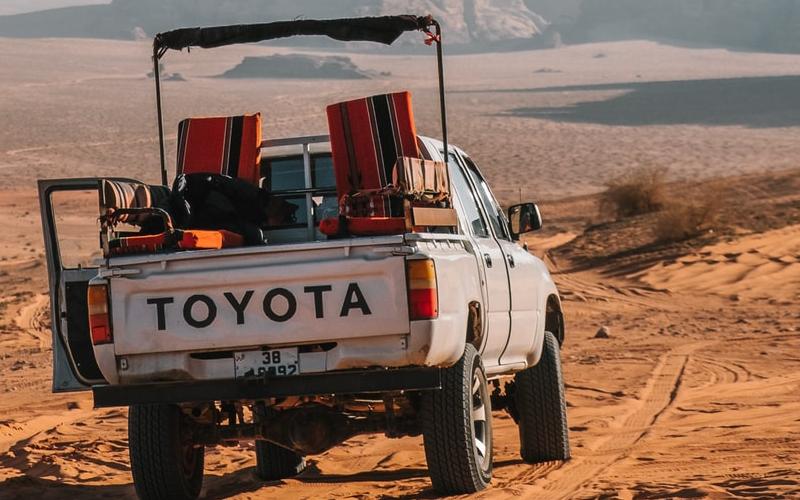
Tradies everywhere will also rejoice at the Toyota Hilux sales figures, which claimed number one spot for top selling vehicles in 2019, with a total of 47,649 sales.
In number two spot was the Ford Ranger with just under 41,000 sales, followed by the tried and true Toyota Corolla at just over 30,000 sales.
The Mitsubishi ASX was the biggest winner out of the overall disappointing results, with a 60.8 per cent increase in sales on 2018.
| Rank | Vehicle | Dec 19 | Dec 18 | % Diff |
| 1 | Toyota Hilux | 3917 | 3871 | 1.2% |
| 2 | Ford Ranger | 3348 | 3365 | -0.5% |
| 3 | Toyota Corolla | 2777 | 2311 | 20.2% |
| 4 | Mitsubishi Triton | 2315 | 2000 | 15.8% |
| 5 | Toyota RAV4 | 2212 | 1729 | 27.9% |
| 6 | Mitsubishi ASX | 2091 | 1300 | 60.8% |
| 7 | Hyundai i30 | 1935 | 1772 | 9.2% |
| 8 | Isuzu Ute D-Max | 1880 | 2184 | -13.9% |
| 9 | Mazda CX-5 | 1828 | 1990 | -8.1% |
| 10 | Toyota Landcruiser | 1618 | 1690 | -4.3% |
Overall, Toyota led the market share department with 19.4 per cent of sales, followed by Mazda with 9.2 per cent.
New South Wales led the states in car sales, at 26,683 - a 1.4 per cent improvement on 2018; the biggest slide was South Australia with a 18.3 per cent decrease in car sales.
How car sales are recorded
In lieu of sales figure announcements, the FCAI noted further improvements to VFACTS' data recording system.
“Like any data platform, continuous improvement is a key requirement,” Mr Weber said.
“For this reason, we have instituted a further confirmation on data presented to the VFACTS system from our members.
"This data is, as necessary, verified against the national registration data base and, when confirmed, vehicles are accepted into the monthly VFACTS reporting system.”
.jpg)

 Denise Raward
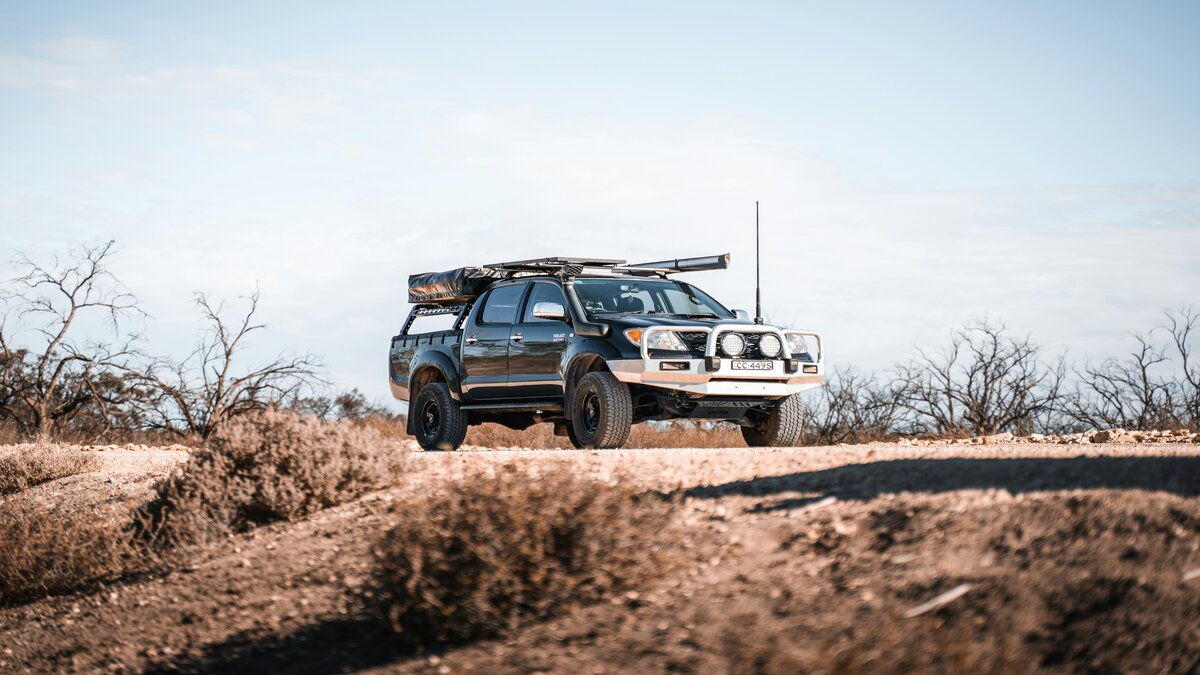
 Harry O'Sullivan