According to the Federal Chamber of Automotive Industries (FCAI), there was a 9.8% decrease in sales of new cars in November 2019 compared to November 2018, with 84,708 cars sold in total.
On a year-to-date basis (1 January 2019-31 November 2019), total sales for 2019 have been recorded as 978,628 new cars, an 8.2% decrease on year-to-date 2018.
This follows a 9.1% decrease in sales in October and a 6.9% decrease in September.
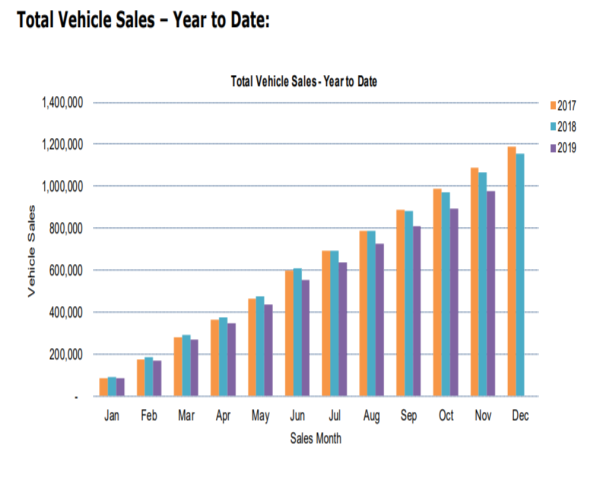
Source: FCAI
FCAI Chief Executive Tony Weber said it’s a tough market full stop for cars.
“The industry has been looking for a lift for some time now and has activated multiple levers to achieve some stimulation, including incentives, sales and special vehicle editions,” Mr Weber said.
“However, the appetite for new vehicles remains suppressed.
“On the bright side, there has never been a better time to purchase a new vehicle.”
December can often be a good time to buy a car, with current-year models set to become ‘old’ once the calendar ticks over.
A 2019 model doesn’t sound quite as sexy as a 2020 model, and prices may be dropped accordingly.
Mr Weber says the holiday season is indeed a great time to act.
“With over 60 brands and more than 350 models, the Australian market is one of the most competitive in the world,” he said.
“This is great news for consumers who have an abundance of choice and pricing options when it comes to selecting a new vehicle.”
Looking for a good value car loan? The table below displays a snapshot of some of the lowest-rate fixed-interest car loans for new cars.
| Lender | Car Loan | Interest Rate | Comparison Rate* | Monthly Repayment | Interest Type | Vehicle Type | Maximum Vehicle Age | Ongoing Fee | Upfront Fee | Total Repayment | Early Repayment | Instant Approval | Online Application | Tags | Features | Link | Compare | Promoted Product | Disclosure |
|---|---|---|---|---|---|---|---|---|---|---|---|---|---|---|---|---|---|---|---|
6.59% p.a. | 7.72% p.a. | $588 | Fixed | New | No Max | $8 | $400 | $35,295 |
| Promoted | Disclosure | ||||||||
6.28% p.a. | 6.28% p.a. | $584 | Fixed | New | No Max | $0 | $0 | $35,034 |
| Promoted | Disclosure | ||||||||
6.52% p.a. | 6.95% p.a. | $587 | Fixed | New, Used | No Max | $0 | $350 | $35,236 |
| Promoted | Disclosure | ||||||||
5.76% p.a. | 5.76% p.a. | $577 | Fixed | New, Used | No Max | $0 | $275 | $34,599 | |||||||||||
5.99% p.a. | 6.34% p.a. | $580 | Fixed | New | No Max | $0 | $250 | $34,791 | |||||||||||
6.25% p.a. | 6.52% p.a. | $583 | Fixed | New | No Max | $0 | $195 | $35,009 | |||||||||||
6.49% p.a. | 6.84% p.a. | $587 | Fixed | New, Used | No Max | $0 | $250 | $35,211 | |||||||||||
6.29% p.a. | 7.71% p.a. | $584 | Fixed | New, Used | No Max | $15 | $250 | $35,042 | |||||||||||
5.67% p.a. | 6.10% p.a. | $575 | Fixed | New | No Max | $0 | $0 | $34,524 | |||||||||||
7.99% p.a. | 8.99% p.a. | $608 | Fixed | New, Used | No Max | $9 | $265 | $36,489 | |||||||||||
7.99% p.a. | 8.27% p.a. | $608 | Fixed | New | No Max | $0 | $200 | $36,489 |


Which cars sold the most?
As usual, the Toyota Hilux remains Australia’s most popular vehicle with 3,687 units sold, likely thanks to its popularity with tradespeople and businesses, although year-on-year sales have fallen by a significant 21%.
The Ford Ranger came in at number two with 3,491 units sold (a 0.6% decrease), while the third-placed Mitsubishi Triton saw a near 30% increase in sales (3,123 units sold in November 2019).
The 7th placed Toyota Camry saw a massive 54% increase in sales, while the Toyota Landcruiser rounded out the top 10 with 1,641 new sales in November.
| Rank | Vehicle | Nov-19 | Nov-18 | % diff |
|---|---|---|---|---|
| 1 | Toyota Hilux | 3,687 | 4,671 | -21.1% |
| 2 | Ford Ranger | 3,491 | 3,469 | 0.6% |
| 3 | Mitsubishi Triton | 3,123 | 2,404 | 29.9% |
| 4 | Hyundai i30 | 2,339 | 2,378 | -1.6% |
| 5 | Toyota RAV4 | 2,316 | 1,936 | 19.6% |
| 6 | Toyota Corolla | 2,229 | 2,659 | -16.2% |
| 7 | Toyota Camry | 2,001 | 1,295 | 54.5% |
| 8 | Nissan XTrail | 1,882 | 1,942 | -3.1% |
| 9 | Mazda CX-5 | 1,735 | 1,998 | -13.2% |
| 10 | Toyota Landcruiser | 1,641 | 1,995 | -17.7% |
Source: FCAI
Sales of cars in Western Australia were strong relative to the other states.
November new car sales in WA fell by just 0.8% – every other state saw a decline of at least 9%.
The Northern Territory, for example, saw a 20.7% fall, while the ACT and South Australia had falls of just under 15%.


 Denise Raward
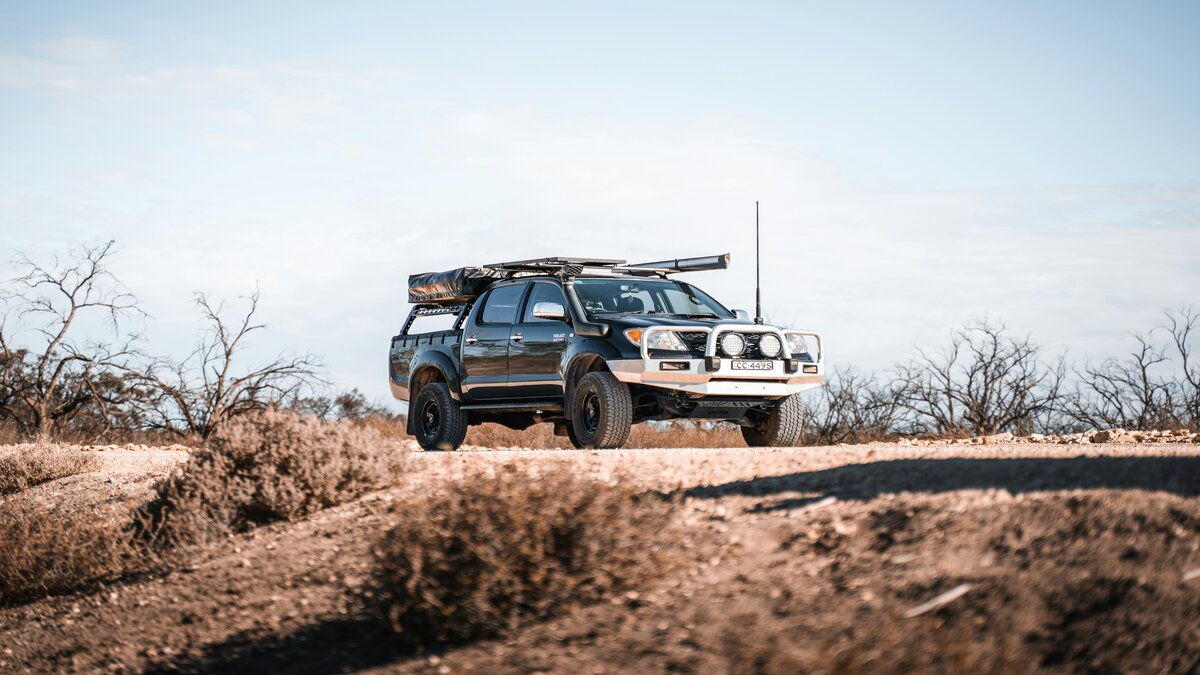
 Harry O'Sullivan

 Dominic Beattie
 William Jolly