Two days ago, Commonwealth Bank predicted home price rises of 16% over the next two years.
Today, AMP chief economist Dr Shane Oliver said home prices will rise 5% to 10% in 2021 alone as "ultra-low interest rates and economic recovery feed through".
"The latest long-term boom started in the mid-1990s. The key drivers of this boom have been easier access to debt and the shift from high to low interest rates," he said.
Despite the prediction, it's not all rosy, with Dr Oliver predicting a flatter period in the next few years.
"However, the outlook is divergent – with houses expected to outperform units and smaller cities and regional property expected to play catch up," he said.
"The drivers of the long-term property bull market may start to wane over the next 3-5 years."
"Supply is likely to remain strong this year and next, but population growth has collapsed and could take years to recover. This may take some pressure off house prices on a 3-5 year view."
This timeline also coincides with how long the Reserve Bank expects the cash rate to be at a record-low level.
Dr Oliver said the bullish market is due to the unique year that was 2020.
"Put simply - record low mortgage rates, multiple government home buyer incentives, government income support measures, pent up demand from the lockdowns, bank mortgage payment holidays, activity associated with a desire to 'escape from the city' and an emerging element of FOMO (fear of missing out) have swamped the negative impact of higher unemployment, a collapse in immigration and weak rental markets in Sydney and Melbourne," he said.
But Dr Oliver also tempered predictions, calling the home price boom "cyclical".
"A common property myth is that prices only ever go up. But this is not so," he said.
"Real Sydney house prices (after inflation) fell ... 7% in 2008-09, 3% in 2011-12, 3% in 2015-16 and 15% in 2017-19."
House price predictions are a tempestuous issue, with CommBank predicting at the start of lockdowns last year that home prices would fall up to 30%.
Simon Pressley, chief economist at national buyers agency Propertyology, said the banks have "shit the bed".
"As recently as April 2020, Australia’s biggest bank forecast national real estate prices to decline by 20%. Four months later they revised it to a 10% decline," Mr Pressley said.
"Then in November they said prices would increase by 5%. Now they are forecasting growth of 8%.
"So, they’ve published four property market forecasts within 10-months, with a 28% variance in their highest to lowest dart-throwing exercise."
Property prices in the smaller capital cities & regional property lagged Sydney & Melbourne over the last decade. They may now be starting to catch up helped by “work from home”/“escape from the big city”, much lower rental vacancy rates & less exposure to the hit to immigration. pic.twitter.com/gXo6eugJW0
— Shane Oliver (@ShaneOliverAMP) February 17, 2021
Is a fiscal cliff coming?
There has been much talk about a 'fiscal cliff' due in March after JobKeeper and JobSeeker are wound back, with mortgage deferrals also coming to an end.
Ratings agencies have also flagged late March as a risk in the mortgage market.
"Arrears are expected to increase in the early part of 2021 as borrowers exit payment holidays and income assistance packages come to an end, though the impact will be tempered by low interest rates and COVID-19 related job losses that have affected tourism, leisure and hospitality sectors," a Standard and Poor's (S&P) report said.
S&P also said poor wage growth, the flood of first home buyers in the market, and changes to responsible lending also pose risks.
Despite this, Dr Oliver said mortgage serviceability remains high.
"The share by value of housing loans on bank payment holidays has collapsed from 11% in May to just 2.4% in December," he said.
"And the collapse in mortgage rates – that has seen household interest payments as a share of income fall to their lowest since the mid-1980s – has helped.
"In the absence of an unexpected renewed economic downturn, it’s hard to see much rise in distressed sales."
However, the tinkering of a major Reserve Bank funding program could spell the end of 'record low' rates in June.
Hedonic suggests that if you bought in Sydney 4 years ago, and factoring in 80%LVR, SD, agent fees, inflation, you still need prices to rise by ~20% to breakeven despite house prices being around the same in nominal terms. Property is an expensive asset to hold.
— Lindsay David (@linzcom) February 10, 2021
Is affordability getting worse?
Dr Oliver also said housing affordability is poor, with the median multiple of house prices to income being 5.9 in Australia compared to 3.6 in the United States and 4.5 in the United Kingdom.
In Sydney this ratio is 11-times income, and Melbourne's is 9.5.
"The surge in prices relative to incomes has seen the ratio of household debt to income rise 5-fold over the last 30 years, taking it from the low end of OECD countries to the high end," Dr Oliver said.
"The surge in immigration played a big role in the outperformance of Sydney and Melbourne into 2017 and this is now going into reverse as other cities and regional centres are benefitting from the 'escape from the city' phenomenon."
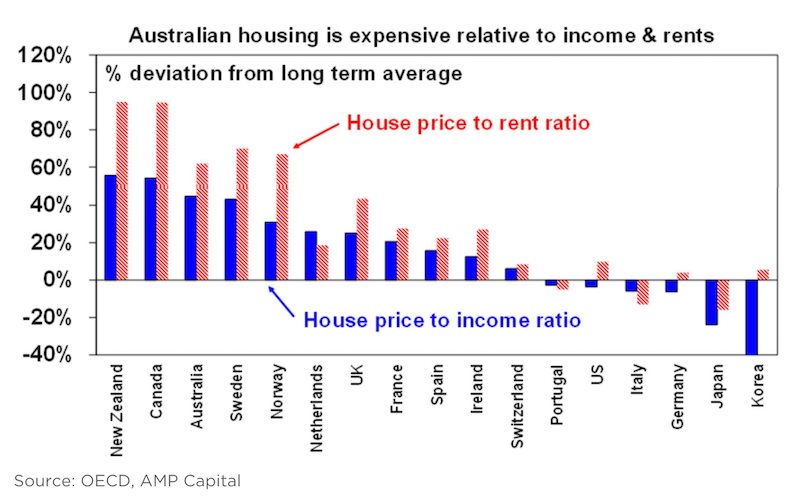
Photo by Steve Doig on Unsplash

Ready, Set, Buy!
Learn everything you need to know about buying property – from choosing the right property and home loan, to the purchasing process, tips to save money and more!
With bonus Q&A sheet and Crossword!
.jpg)

 Harry O'Sullivan
 William Jolly