It was meant to be the ‘once in a generation event’. For those born at the wrong time, their prime working lives were faced with three financial crises - the 00s dotcom bubble burst, the Global Financial Crisis, and now the Covid-related recession.
The 2007-09 Global Financial Crisis, or GFC, or Great Recession, had its footings in some pretty complex financial fluff. Yet the effects were very real, and very understandable. People lost jobs, homes, and their livelihoods. Some effects are still felt today.
Much of the literature surrounding the GFC relates to the United States, so we’ll give an overview of that before jumping into the Australian experience.
Strap yourselves in, it's a big one.
Advertisement
Buying a home or looking to refinance? The table below features home loans with some of the lowest interest rates on the market for owner occupiers.
| Lender | Home Loan | Interest Rate | Comparison Rate* | Monthly Repayment | Repayment type | Rate Type | Offset | Redraw | Ongoing Fees | Upfront Fees | Max LVR | Lump Sum Repayment | Extra Repayments | Split Loan Option | Tags | Features | Link | Compare | Promoted Product | Disclosure |
|---|---|---|---|---|---|---|---|---|---|---|---|---|---|---|---|---|---|---|---|---|
5.54% p.a. | 5.58% p.a. | $2,852 | Principal & Interest | Variable | $0 | $530 | 90% |
| Promoted | Disclosure | ||||||||||
5.49% p.a. | 5.40% p.a. | $2,836 | Principal & Interest | Variable | $0 | $0 | 80% |
| Promoted | Disclosure | ||||||||||
5.64% p.a. | 5.89% p.a. | $2,883 | Principal & Interest | Variable | $250 | $250 | 60% |
| Promoted | Disclosure | ||||||||||
5.64% p.a. | 5.89% p.a. | $2,883 | Principal & Interest | Variable | $248 | $350 | 60% |
| Disclosure |


")

What was the cause of the 2007-2009 Global Financial Crisis?
While the iceberg sank the Titanic, ineptitude led it there. The same goes for the GFC - there wasn’t any single event that caused it, rather a maelstrom of crap hitting the proverbial fan. It’s generally accepted that loose lending, a housing bubble burst, and bad bank investments led to a near worldwide financial collapse. As they say, if the US sneezes, the whole world catches a cold.
To find out some of the root causes, we have to go back to the early 2000s.
Pre-GFC landscape
In the wake of the early-00s dotcom bubble burst and the September 11 2001 attacks, credit became easier to acquire. From 2000 to 2003 the US Federal Reserve lowered its federal funds rate (cash rate) from 6.5% to 1.0% to stimulate inflation and spending, which spurred on a credit-fuelled housing boom.
Many banks eased their own lending criteria amid strong house price growth, and suddenly housing in the US was seen as the ticket to financial independence. This was grouped with a housing construction boom and low interest rates.
See Also: Non-Recourse Loans Explained
Freddie Mae and Freddie Mac
Some of the biggest mortgage players in the country are two government-backed entities - Fannie Mae and Freddie Mac. They originate no loans themselves but instead buy and guarantee mortgages from lenders in a secondary mortgage market, explained further below.
For the two entities to consider mortgages worthy, they must be ‘prime’ - high quality borrowers with good credit scores of 720 or higher on the ‘FICO’ index, explained further below. Until the 2000s they dominated the secondary mortgage market.
Non-government backed entities and subprime loans
In the 2000s there was the proliferation of ‘subprime’ mortgages - those that fall outside Freddie and Fannie’s target markets, meaning lower quality borrowers with credit scores under 620. There were also ‘Alt-A’ mortgages, which were borrowers somewhere in the middle.
These were distributed by direct-to-consumer secondary entities who bought packaged loans off originators who made their money on volume.
And there was initially merit to subprime borrowing, too - they helped increase home ownership rates.
“One noteworthy feature associated with the expansion of non-prime lending has been the rise in home-ownership rates, particularly amongst minorities, that it has facilitated,” said Guy Debelle in 2008, then the RBA’s Assistant Governor.
“This needs to be kept in mind when thinking about the problems that have subsequently resulted.”
|
Average US Mortgage Characteristics – December 2007 (Sample averages; per cent unless otherwise stated) |
|||
|
Sub-prime |
Alt-A |
Prime |
|
|---|---|---|---|
|
Interest rate |
8.68 |
6.93 |
5.79 |
|
FICO Score |
617 |
704 |
730 |
|
LVR |
85 |
81 |
70 |
|
Balance ($US '000) |
181 |
299 |
309 |
|
Low doc |
30 |
53 |
0 |
|
On variable/adjustable rates |
59 |
40 |
- |
|
Owner-occupied |
91 |
72 |
- |
|
Delinquency Rate (30 days) |
24.5 |
4.5 |
3.2* |
|
Foreclosure Rate |
8.5 |
2.9 |
1.0* |
|
Source: Federal Reserve Bank of New York; Loan Performance; Mortgage Bankers Association, via the Reserve Bank of Australia |
|||
The US mortgage market
The United States' mortgage market is at times arcane and convoluted. There are mortgage originators and the secondary market. Originators make money off the volume of mortgages they sell to the secondary market.
In further comparison to the Australian and US mortgage markets, Mr Debelle said originators in the US lacked accountability.
“The originators had no long-term incentive, beyond reputation, to ensure that the underwriting standards were adequate,” Mr Debelle said.
“As the flow of new loans showed signs of diminishing in 2005 with the rise in US interest rates, the originators appear to have eased lending standards to maintain the flow.”
On a product level, in the mid-2000s such was the thirst for new mortgages that lenders began offering fruitier mortgage products. This includes ‘teaser rates’ - low fixed rates for a few years, followed by much higher adjustable rates. It also wasn’t uncommon to borrow more than the value of the home - 125% LTV or ‘LVR’ home loans weren’t uncommon - e.g. borrowing $625,000 for a $500,000 home.
At times banks also required no proof of income - a borrower’s word was good enough. ‘NINJA’ loans were also prevalent - No Income No Job Applications. ‘Jumbo’ loans were also common, which is a type of mortgage that exceeds the limits set by the Federal Housing Finance Authority. In 2022 the cap is $647,200 for most of the US.
An example of some of the more colourful aspects of the US mortgage market are on display in these screen grabs of NetBank from late 2005 to 2007 - a direct bank that was closed in late-2007 by regulators over fears of a bank run. Its deposits were subsequently acquired by ING.
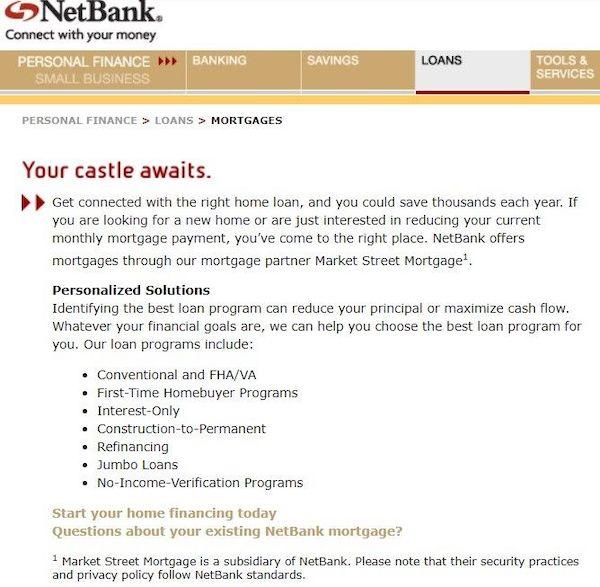
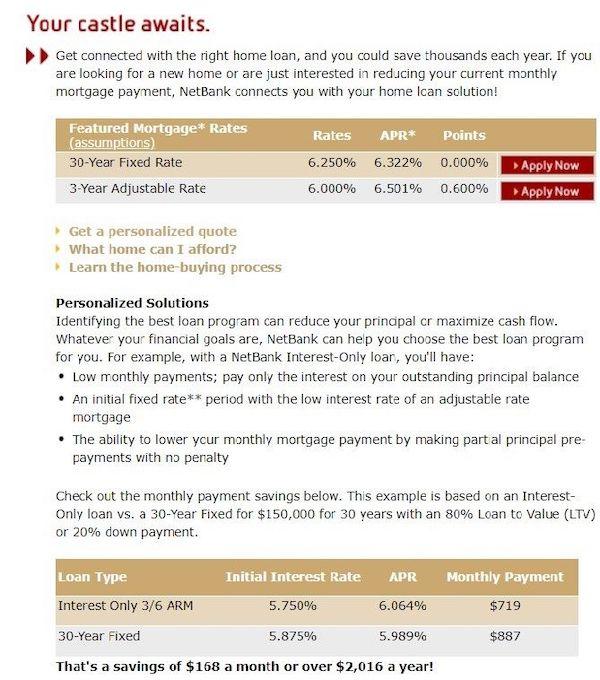
via WayBack Machine
Cracks appear in the mortgage market
CoreLogic’s Washington bureau notes about a third of all mortgages in 2006 were low or no doc, or subprime.
Borrowers with poor credit scores could also easily get mortgages. ‘FICO’, a type of credit rating in the US, rates borrowers on a scale of 300-850. From 2004 to 2006, borrowers could get access to the lowest mortgage rates with a score as low as 620 to 640. Borrowers tapping into the Federal Housing Administration mortgage scheme could get low rates with a FICO score as low as 500.
In the years leading up to the GFC, those with FICO scores of under 640 made up 25% of the US' mortgage pool - now they make up less than 5% - and nowadays around 70% of mortgages are held by people with scores 700 or higher by some estimates.
According to beSpacific, a law and technology research institute, an estimated 9% of all US mortgages by August 2008 were delinquent or in foreclosure, rising to 14% by September 2009. Delinquent refers to when homeowners are at least 30 days overdue on making at least one mortgage payment - 90 days typically signifies default.
Securitisation’s role in the GFC
Securitisation can best be described as a massive Jenga tower. Mortgage-backed securities pool thousands of mortgages together, package them up and sell a ‘coupon’ to institutional investors who expect a rate of return.
Institutional investors refer to other banks, retirement funds, hedge funds, local governments and so on. This type of security is used to fund other pools of mortgages, and so the growth continues.
The riskier the pool of mortgages, the higher the potential rate of return. Once again, all good if house prices continue to rise, but not so good if there’s a house price collapse.
On top of that, there’s strength in numbers. Thousands of seriously subprime mortgages could be bundled up into ‘collateralised debt obligations’ or CDOs - a type of subprime security the rating agencies' methodologies could somehow rate as ‘safe’ i.e. investment grade of BBB- or better.
-
The reason many institutional banks went under was because they were highly exposed to these bad investments. They bought pools of these home loans from originators, didn’t do their due diligence, and then packaged them up as securities for investors.
Mortgage securities before '08 were labyrinthine and opaque. The sheer number of mortgages that were in all kinds of different securities, the many hands that exchanged them, and the complex nature of some of the securities meant that investors and investment banks couldn’t properly assess what they were getting into.
See Also: What are mortgage-backed securities?
The credit rating agencies
Now securitisation itself is nothing to fear, but if the underlying pool of mortgages is fruity, then that gives rise to some issues. Further, for guaranteed flow of business, the credit ratings agencies Moody’s, Standard & Poor’s, and Fitch were enticed to rate pools of mortgages favourably, or overlook the bad ones.
In a Congress grilling of the brass of the ratings agencies on 22 October 2008, California representative Henry Waxman remarked:
At Moody's, profits quadrupled between 2000 and 2007. In fact, Moody's had the highest profit margin of any company in the S&P 500 for five years in a row. Unfortunately for investors, the triple-A ratings that proved so lucrative for the rating agencies soon evaporated. S&P has downgraded more than two-thirds of its investment-grade ratings. Moody's had to downgrade over 5,000 mortgage-backed securities.
In one document, an S&P employee in the structured finance division writes, ‘it could be structured by cows, and we would rate it.' In another, an employee asserts, ‘rating agencies continue to create an ever bigger monster, the CDO market. Let's hope we are all wealthy and retired by the time this house of cards falters.’
Representative Waxman also detailed anecdotes of agency analysts who asked for more access and time to assess the underlying pools of mortgages for their quality, but were denied by their managers.
“The story of the credit rating agencies is a story of a colossal failure,” Waxman remarked.
“The credit rating agencies occupy a special place in our financial markets. Millions of investors rely on them for independent objective assessments. The rating agencies broke this bond of trust, and Federal regulators ignored the warning signs and did nothing to protect the public.”
|
Default rates of US corporate bonds - 2008 |
||
|---|---|---|
|
Ratings |
Moody’s - default rates |
S&P - default rates |
|
Aaa/AAA |
0.52 |
0.60 |
|
Aa/AA |
0.52 |
1.50 |
|
A/A |
1.29 |
2.91 |
|
Baa/BBB |
4.64 |
10.29 |
|
Ba/BB |
19.12 |
29.93 |
|
B/B |
43.34 |
53.72 |
|
Caa-C/CCC-C |
69.18 |
69.19 |
|
Investment Grade Overall (i.e. BBB<) |
2.09 |
4.14 |
|
Non-Invest Grade |
31.37 |
42.35 |
|
All |
9.70 |
12.98 |
Source: US Government Publishing Office, 110th Congress 2007-2009
The Big Short explained
You might have seen the 2015 film ‘The Big Short’, starring Christian Bale, Steve Carell and yes Margot Robbie in a bathtub.
In 2005, Michael Burry (Christian Bale) did what the ratings analysts should have done - assessed the underlying pools of mortgages with a fine-toothed comb. He discovered a large swathe of loans had ‘teaser’ rates to poor-quality borrowers expiring soon. The teaser rates would then be followed by sky-high fixed rates, potentially forcing thousands of borrowers underwater, and rendering a lot of mortgage securities worthless.
He invented what is called a ‘credit default swap’ - a type of insurance premium that in the event of mortgage security default, the insurer would pay the policyholder a large sum of money. In effect, he bet against a company, or ‘shorted’ them.
In this case, his first target was a Deutsche Bank mortgage security valued at $60 million. Because the securities were rated as safe, the bank saw Burry’s insurance premium as basically free money. Then over the next couple of years, Burry’s bet paid off. It’s estimated his investment firm Scion Capital earned $800 million throughout the Great Recession.
Dwelling prices decline
A lot of heartache could have been avoided had house prices increased in a sustainable fashion - but some time in 2006 house prices flatlined. This was largely due to interest rates starting to rise, which took heat out of the market - the Fed’s funds rate increased from about 1.0% in 2003 to 5.0% by 2006.
Prior to the GFC was a sharp run-up of housing prices - a housing bubble. A 2017 economics bulletin from Norway’s Trondheim Business School (NTNU) shows dwelling prices rose in the US 54.1% in the five years to quarter-one 2006. In the five years to quarter-four 2011, prices declined 37.1%.
The Standard and Poor’s Case-Shiller home price index, which measures prices across 20 metro areas of the US, fell 18% in a year between October 2007 to October 2008. This undid more than four years of growth.
CoreLogic US estimates dwelling prices fell a collective 33% throughout the country during the recession. Some areas were hit a lot harder than others. Take Detroit, for example. After General Motors and Chrysler declared bankruptcy, and before the US Government bailed them out for $17.4 billion, it wasn’t uncommon to see properties sold for under $100.
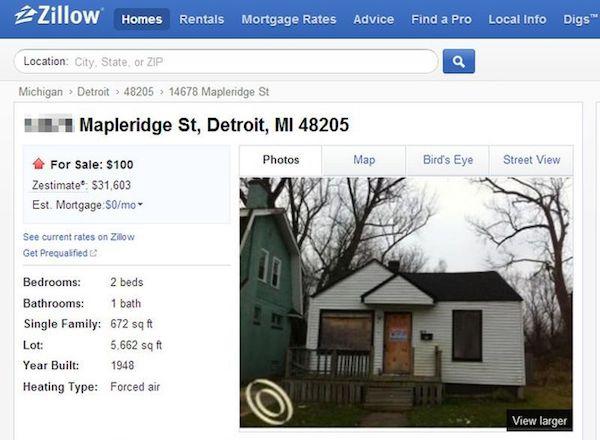
$1 million in Sydney? Source: Zillow via NY Daily News, Circa 2013
When was the GFC? A timeline of bank collapses and share market falls
The commonly accepted timeline of the GFC is from 2007 to 2009, though some of the effects were felt sharply and for a long time after that.
The common flashpoint for the GFC starting was in April 2007 when New Century, a real estate investment trust, declared bankruptcy.
The firm was exposed heavily to subprime lending and securitised mortgages, which turned out to be inappropriately rated as ‘safe’ by the big credit rating agencies.
It continued in July 2007 with the collapse of two hedge funds owned by investment bank Bear Stearns. This happened after Bear Stearns bailed out the two funds with US $20 billion worth of collateralised debt obligations - subprime mortgage securities - in which the underlying pool of loans turned out to be worthless. This essentially kicked the can down the road.
Teetering on collapse, Bear Stearns was acquired by full-service bank JP Morgan Chase at $2 per share - much less than its previous highs of $160-plus a share. The Federal Reserve (the US central bank) injected $30 billion to complete the deal.
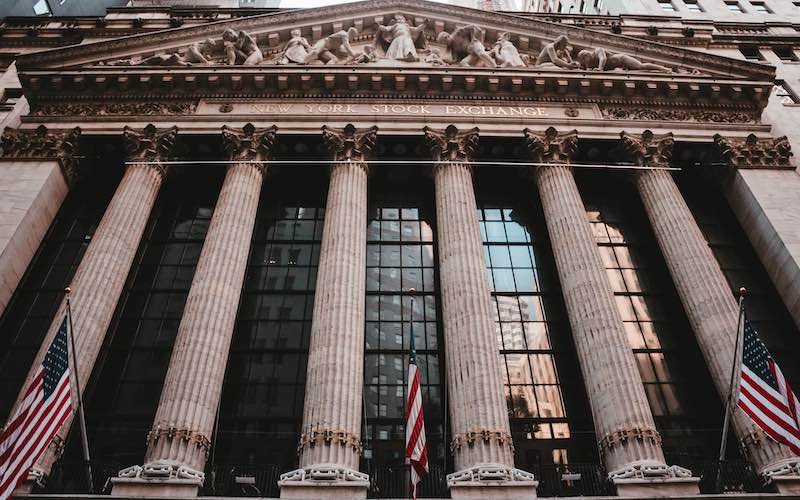
Arguably the biggest scalp, and the climax of the crisis, was the collapse of Lehman Brothers investment bank on 15 September 2008. This led to a 514 point drop on the Dow Jones Industrial Average share index, the worst decline in seven years at that point. Lehman Brothers held more than $600 billion in assets.
On the same day, Merrill Lynch - another investment bank - was acquired by Bank of America in a US $50 billion deal.
On 29 September 2008, the House of Representatives rejected the ‘Emergency Economic Stablization Act of 2008’, including $700 billion in bank bailouts. The Dow Jones dropped more than 777.68 points - the largest single-day points drop in history.
By 1 October, the Senate passed the Act, including the $700 billion bank bailout program - the Troubled Asset Relief Program, or TARP. The money essentially was used to guarantee against losses of failing mortgages from some of the biggest banks and insurance groups.
On 27 February 2009 the Dow Jones closed at its lowest value since 1997 when the US Government increased its stake in Citigroup, while GDP slowed at the sharpest pace in 26 years.
First introduced as a prototype in December 2009, and passed in July 2010, the ‘Dodd-Frank' reforms ushered in a new era of banking regulations, including the regulation of swaps and other derivative investments.
With it, the reforms also introduced the CFPB - the Consumer Financial Protection Bureau - that protects consumers against predatory lending.
Research by SNL Financial shows 15 of the 20 largest mortgage originators in 2006 no longer exist. Names such as Countrywide Financial, Washington Mutual, National City Bank, Wachovia, IndyMac, and more - have either gone up in a plume of smoke or had their scraps acquired by much bigger fish.
In 2006 there was nearly $2.6 trillion worth of mortgage originations made - by 2011 that figure was less than $1.5 trillion.
See Also: Which recession was worse? 1990s, GFC, or Covid?
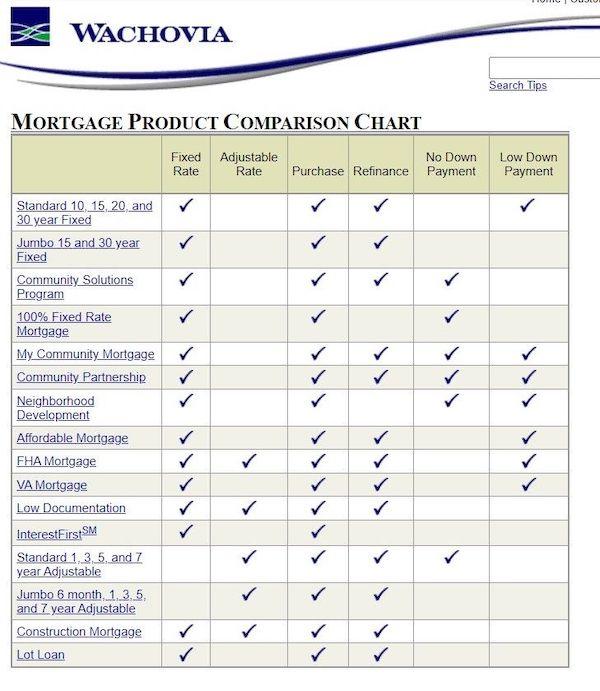
Wachovia website, 2005 - six mortgage products required no down payment, and the ‘InterestFirst’ line allowed interest-only payments for 15 years. Sourced via Wayback Machine.
Effects of the GFC
By some estimates, the global economy lost a collective US $2 trillion in GDP. US Treasury estimates peg total lost household wealth in the US at $19.2 trillion. The US Government over the years poured $23 trillion into recovery programs and bailouts. Non-profit financial watchdog Better Markets also estimates the US real estate industry lost about $7 trillion; US sharemarkets declined $11 trillion; and retirement accounts lost about $3.4 trillion.
Global Financial Crisis in Australia
In contrast to the US and many other developed nations, Australia fared relatively well through the GFC. A technical recession counts as two consecutive quarters of negative GDP growth. Australia only had one - December 2008, contracting by 0.5%.
Australia’s GDP performance was supported by a strong iron ore price, driven by China’s insatiable demand for steel. It hit a high of USD $195 per tonne in 2008, and stayed extremely elevated until the end of 2011, apart from a brief dip in 2009.
The Reserve Bank of Australia also had its key weapon ready to fire - the cash rate. It eased monetary policy, lowering the cash rate from 7.25% in August 2008 to 3% by April 2009. This made wholesale funding for banks cheaper, lowered mortgage rates and facilitated spending. Crazy to think of a cash rate of 7.25% now…
Credit growth hit a high of 16.2% in January 2008. Unemployment was also a near record low 4% in August 2008, while underemployment was also low at 5.7%.
Eased monetary policy was also supported by the Rudd Government’s stimulus policies - then controversial, but miniscule in the context of Covid. For consumers, anyone earning under $80,000 a year received a one-time cash payment of $950. People used that to buy huge TVs - retail trade shot up 4.1% in December 2008. There was also a raft of business support measures and infrastructure projects put in place.
Tax as a proportion of GDP was also at a record low through these years, helping to facilitate household and business spending, but has climbed quite dramatically since.
What happened to Australian home prices in the 2008 Financial Crisis?
Dwelling prices were relatively unaffected through the ‘crisis’, with property price growth slowing down in the March 2008 quarter, rising by only 0.8% - much slower than 3.7% growth in the previous quarter - according to Domain.
In 2009, the national median dwelling price jumped 3.5% in the June quarter, 3.9% in September’s, and 4.6% in December’s - quite the contrast to the US.
Across the eight capital cities, Australia’s median home price was $404,875 in September 2008, or $508,024 adjusted for inflation.
RBA’s then-Assistant Governor Guy Debelle said Australia and the US were similar in debt-to-income ratios and asset-to-debt ratios, but explained why Australia’s housing market performance was different.
“The distribution of debt is quite different. Subprime lending makes up a very small share of the Australian mortgage market,” Mr Debelle said.
“The bulk of household debt in Australia tends to be owed by those with the highest incomes who are most able to service their loans.
“Non-conforming [subprime] loans in Australia accounted for only about 1% of outstanding loans in 2007, well below the 13% subprime share in the US.”
However it wasn’t all rosy, with many businesses and livelihoods taking a hit, and the effects are still seen today.
Underemployment
Underemployment has generally remained elevated since the GFC. Underemployment is simply defined as people who are employed but aren’t getting as many hours as they’d like.
Part of this can be attributed to the rise of the gig economy such as food delivery, rideshare and gig platforms such as Airtasker. However, secure stable full-time employment has arguably been harder to come by since the GFC.
It took more than 13 years for underemployment to return to its pre-GFC levels. Also, skilled job vacancies only recovered from the post-GFC slump in October 2021.
Bank acquisitions
The acquisition and scrap-picking frenzy was a lot more subdued in Australia compared to the US.
Some of the biggest transactions included:
-
Westpac acquiring RAMS and St. George Bank.
-
Commonwealth Bank acquiring Bankwest, and a stake in Aussie Home Loans
Westpac acquired RAMS in late-2007 for a reported AUD $140 million.
On 1 December 2008 Westpac completed the acquisition of St. George in an estimated $19 billion deal, reported to be 2.7 times ‘book’ value.
Commonwealth Bank acquired Bankwest from British bank HBOS in late 2008 for a sum of $2.1 billion - an estimated 20% below ‘book’ value.
The struggling British HBOS was taken over by giant Lloyds TSB in a British-government backed bid.
In 2008, CBA also bought a one-third stake in Aussie Home Loans.
At one stage, CBA was also rumoured to be in talks with Suncorp to acquire its banking and wealth management businesses.
It’s important to note that these lenders were not necessarily on the brink of collapse like with many lenders in the United States, rather the major banks saw value in bidding with the smaller lenders' values hit by the recession.
Share markets
Share markets got spooked in Australia. The All Ordinaries' worst day during the crisis was 10 October 2008 when it plummeted 8.2%. Its worst year was also 2008, declining 43.01%.
The ASX 200 peaked at 6,700 points on 26 October 2007, before continuous falls over the next 16 months, bottoming out at 3,124 points on 6 March 2009.
It took more than 10 years for the index to return to its heady levels, surpassing the 6,700 mark in mid-2019.
This is a new golden age for sad trader pictures pic.twitter.com/Tswb6DrAuh
— Mark Gongloff (@markgongloff) March 3, 2020
Spending and inertia
Before and during Covid, the government’s message to consumers was ‘SPEND MONEY!’. This was despite promising its own fiscal responsibility, trying to get the Budget back in black and rein in Australia’s debt.
However, inflation has been sluggish, even despite the RBA cutting the cash rate from 4.75% in 2010 down to a low of 0.10% by November 2020.
Annual credit growth slowed to 1.0% in March 2021, and savings account and term deposit rates plummeted to record lows.
Quarterly GDP growth was less than 1% each quarter from September 2013 to December 2016 where it rose 1.1% - it didn’t hit the 1% mark again until September 2020.
The nation also experienced a per-capita recession in the second half of 2018 - declining 0.1% in the September quarter, and 0.2% in the December quarter. Per capita recessions refer to output per person declining for two consecutive quarters.
One-year term deposits averaged just 0.90% p.a. in March 2020 when Covid hit.
Retail trade turnover was also sluggish in the lead up to Covid, before plummeting 17.4% in April 2020.
While Australia escaped a technical recession, pain was felt in a lot of other areas, with the GFC leaving an indelible scar on the economy.
Photo by Aditya Vyas on Unsplash

Ready, Set, Buy!
Learn everything you need to know about buying property – from choosing the right property and home loan, to the purchasing process, tips to save money and more!
With bonus Q&A sheet and Crossword!
.jpg)

 Bea Garcia
 Denise Raward
 Harry O'Sullivan
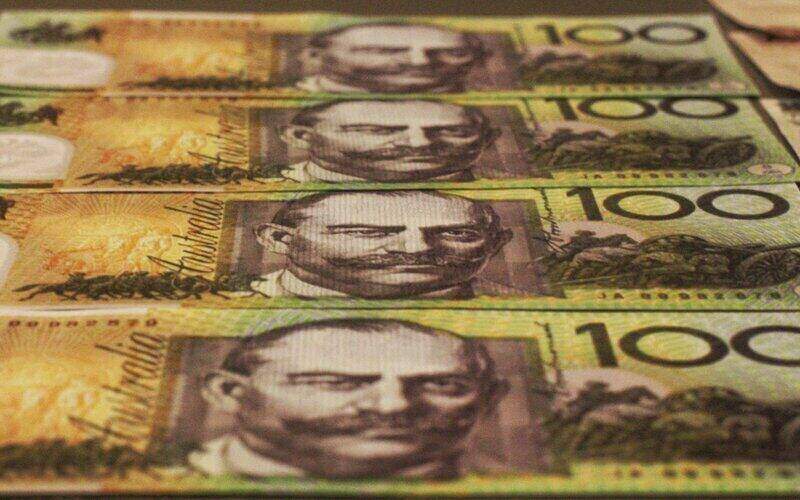
 Brooke Cooper
 Harrison Astbury