
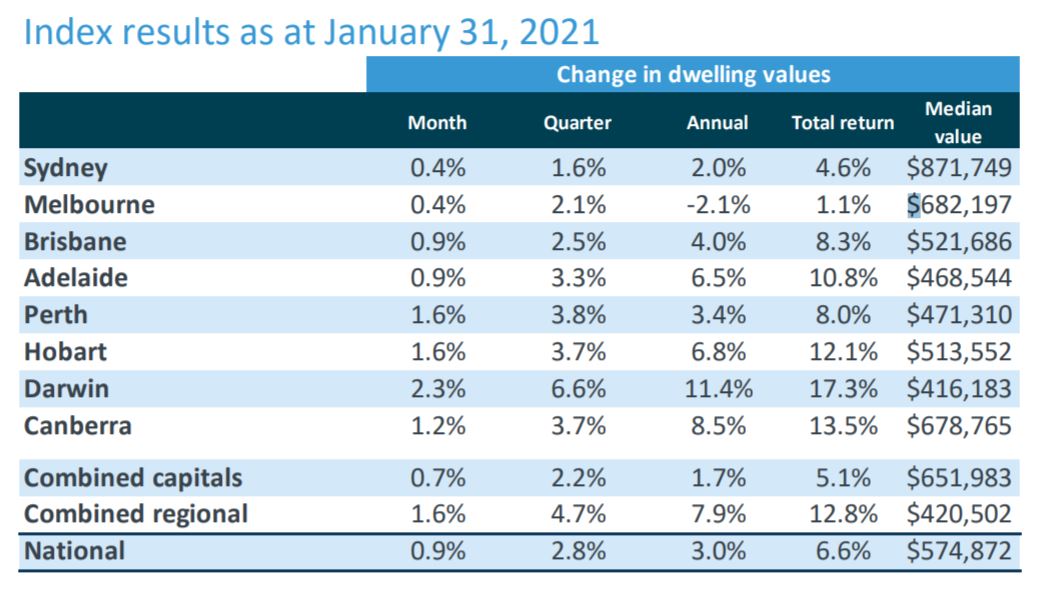
It's the fourth consecutive month of increases, with the national home value index now 0.7% higher than the previous September 2017 peak.
Every capital city and broad rest-of-state region saw an increase in values over the month, with Darwin the strongest of the capitals, up 2.3%.
Sydney and Melbourne both saw a 0.4% increase.
Buying a home or looking to refinance? The table below features home loans with some of the lowest interest rates on the market for owner occupiers.
| Lender | Home Loan | Interest Rate | Comparison Rate* | Monthly Repayment | Repayment type | Rate Type | Offset | Redraw | Ongoing Fees | Upfront Fees | Max LVR | Lump Sum Repayment | Extra Repayments | Split Loan Option | Tags | Features | Link | Compare | Promoted Product | Disclosure |
|---|---|---|---|---|---|---|---|---|---|---|---|---|---|---|---|---|---|---|---|---|
5.54% p.a. | 5.58% p.a. | $2,852 | Principal & Interest | Variable | $0 | $530 | 90% |
| Promoted | Disclosure | ||||||||||
5.49% p.a. | 5.40% p.a. | $2,836 | Principal & Interest | Variable | $0 | $0 | 80% |
| Promoted | Disclosure | ||||||||||
5.64% p.a. | 5.89% p.a. | $2,883 | Principal & Interest | Variable | $250 | $250 | 60% |
| Promoted | Disclosure | ||||||||||
5.64% p.a. | 5.89% p.a. | $2,883 | Principal & Interest | Variable | $248 | $350 | 60% |
| Disclosure |


")

Continuing a trend seen early in the pandemic, regional values more than doubled the growth of their capital city counterparts: Regional values were up 1.6% over February while capital city values were up 0.7%.
Since March last year, regional values have risen 6.5%, while capital city values are down 0.2%.
CoreLogic research director Tim Lawless said New South Wales and Victoria were seeing the greatest divergence in city and regional housing demand.
“Internal migration data shows more people are leaving Sydney and Melbourne for regional areas, resulting in a transition of activity from the metro regions to the outer fringe and regional markets," Mr Lawless said.
"This demographic trend is further compounded by the demand shock of stalled overseas migration."
“Better housing affordability, an opportunity for a lifestyle upgrade and lower density housing options are other factors that might be contributing to this trend, along with the new found popularity of remote working arrangements."
Source: CoreLogic
Another trend seen throughout the pandemic is houses outperforming units, with national house values up 3.5% in the last six months while unit values are unchanged.
Mr Lawless said demand for units had diminished through COVID due to low investor activity and changed living preferences.
"At the same time supply levels are heightened in some precincts. While demand and supply remain imbalanced we are likely to see units continue to underperform relative to detached housing markets.”
CoreLogic said the January results set the foothold for further price rises this year, supported by low interest rates and relaxed lending laws, with significant virus outbreaks the most significant risk to the market.
Rise in values supported by low stock and high activity
CoreLogic found housing supply started the year in a tight position, with the number of new listings added to the market over the four weeks ending January 24 was 3.3% lower than the same period last year and 13.3% below the five-year average.
Melbourne and Perth were the only capitals to buck the trend, with new listings 20.8% higher than a year ago in Melbourne and 2.2% higher in Perth.
“Melbourne vendors may still be playing catch-up from the earlier lockdown period, while in Perth vendors seem to be relishing the best selling conditions seen in many years,” Mr Lawless said.
Despite the new stock entering the market, total advertised inventory started the year at record lows, with national total listings 27.8% lower than this time last year and 29.3% below the five year average.
What stock is on the market is rapidly being snatched up, with new home sales in the past three months 23.9% higher compared to the same period last year.
“With housing activity continuing to rise at above average levels while listing numbers remain well below average, the natural consequence is upwards pressure on housing prices,” Mr Lawless said.
"This is a seller’s market, but for some reason we are still seeing below normal vendor numbers across most markets.
"With sentiment rising and selling conditions favouring the vendor, it is reasonable to expect new listing numbers will rise as the year progresses which may help to temper housing market conditions.”
Rental market dynamic leveling out
After COVID saw weakness in the unit rental market, due to disruption from overseas migration and sectors affected by restrictions more aligned with the rental market, January has seen a turnaround.
Unit rents in Melbourne and Sydney were down 7.8% and 5.6% respectively in January, but the rate of decline eased in the month.
Sydney saw a rise in rents (0.8%) for the first time since March last year and Melbourne unit rents held firm for the month.
"Part time job numbers have now fully recovered back to pre-COVID levels and more businesses are embarking on a return to work program which could be helping to support renewed demand towards inner city rental accommodation," CoreLogic said.
"Additionally, with rental rates now lower for inner city units, improved rental affordability could be attracting more people back to inner city renting."
Photo by Risa Hirabayashi on Unsplash

Ready, Set, Buy!
Learn everything you need to know about buying property – from choosing the right property and home loan, to the purchasing process, tips to save money and more!
With bonus Q&A sheet and Crossword!


 Bea Garcia
 Denise Raward
 Harry O'Sullivan
 Arjun Paliwal
 Rachel Horan