According to new ANZ and CoreLogic research, real estate values fell 8.4% nationally from the 2017 peak to the June 2019 low, providing some temporary relief to housing affordability.
The report also found national dwelling values were 6.5 times higher than gross annual household incomes in June across the capital cities, the lowest level since December 2013.
Senior ANZ economist Felicity Emmet said improvements in housing affordability were shortlived.
“Although affordability has improved following a downturn in housing values, June 2019 marked a turning point as dwelling values again began to outpace household incomes across capital cities, with the exception of Perth and Darwin,” Ms Emmet said.
“The rebound in prices is being driven by a number of factors including record low-interest rates, easier access to credit and more certainty around tax arrangements.”
CoreLogic’s Head of Research Tim Lawless said Melbourne and Sydney are driving the looming price hikes.
“We see more urgency coming back into the market, especially in Melbourne and Sydney where housing values have risen 6 per cent and 5.3 per cent since May,” Mr Lawless said.
“If this trend continues, we could see property prices reach new highs early next year.”
Despite the outlook, Mr Lawless said it wasn’t all bad news for prospective buyers and renters.
“The research shows households are now dedicating the smallest proportion of their incomes towards paying a new mortgage since early 2004 and renters are spending the lowest proportion of their income on accommodation since 2007,” he said.
“This year, we have also seen an increase in the number of areas where it is cheaper to buy than rent, which can be attributed to the lowest interest rates since the 1950’s together with lower housing prices relative to the market peak.”
How long does it take to save for a house deposit in each capital?
Despite improved housing affordability since 2017, Sydney and Melbourne continue to be the least affordable housing markets in Australia as of June 2019.
In Sydney, it would take 11 years to save a 20% deposit while saving 15% of household income, and 43.7% of income would be required to service an 80% LVR mortgage.
In Melbourne, it would take 9.6 years to save a 20% deposit while saving 15% of household income, and 38.4% of income would be required to service an 80% LVR mortgage.
These figures are based on median household income data from the ANU Centre for Social Research and Methods.
Five years ago Hobart was one of Australia’s cheapest capitals to live but has since risen to become the third least affordable, and the most expensive to rent.
Darwin is the most affordable capital to live in, where it would take just under five years to save a 20% deposit and just under 20% of someone’s household income to service an 80% LVR mortgage.
Check out the full set of data for each capital below.
Affordability measures across the regions as at June 2019
| Region | Dwelling value to income ratio | Years to save 20% deposit based on saving 15% of household income | % of household income required to service an 80% LVR mortgage | % of household income required to rent a home |
| Sydney | 8.2 | 11.0 | 43.7% | 31.9% |
| Melbourne | 7.2 | 9.6 | 38.4% | 27.7% |
| Brisbane | 5.8 | 7.7 | 30.8% | 27.0% |
| Adelaide | 6.2 | 8.2 | 32.2% | 28.8% |
| Perth | 5.2 | 6.9 | 27.4% | 23.8% |
| Hobart | 6.5 | 8.6 | 34.3% | 33.9% |
| Darwin | 3.4 | 4.5 | 17.9% | 20.7% |
| Canberra | 5.0 | 6.7 | 26.6% | 24.4% |
Source: ANZ & CoreLogic
National overview of housing affordability
Dwelling value to household income ratio
The report found the national dwelling value to household income ratio has reduced from a recent high of 7.0 in March 2018 to 6.5 at the end of June 2019.
This is the lowest ratio since the December 2013 quarter, with CoreLogic attributing the healthier balance to a reduction in real estate values while household incomes have continued to rise.
In contrast to houses, the unit sector has continued to show substantial affordability, with the ratio for units tracking at 6.0 compared with 6.5 for houses.
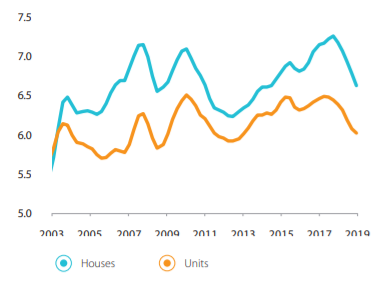
Dwelling value to household income ratio. Source: CoreLogic.
Years to save a deposit
Based on households saving 15% of their gross annual income, it would take the typical Australian household 8.6 years to save a 20% deposit in the June 2019 quarter.
This was down from the March 2019 high of 9.4 years and 9.3 years at the same time a year earlier.
As houses are usually more expensive than units, it takes longer to save for a deposit: 8.9 years compared to 8.0 years to save for a unit deposit.
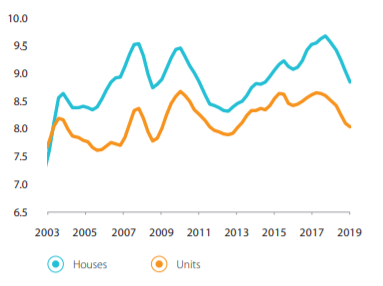
Years to save a deposit. Source: CoreLogic
Share of income required for mortgage repayments
As at June 2019, the repayment on a new 80% LVR mortgage required 34.4% of gross household income.
This is the lowest share dedicated to mortgage repayments since 2004 and substantially lower than the March 2008 peak when 54.2% of household income was dedicated to servicing a new home loan.
Variable mortgage rates were averaging 8.7% in the 2008 peak, in comparison to the June 2019 average of 4.5%.
The typical household was dedicating 35.3% of its annual income to repayments on a house and 32.0% for repayments for a unit.
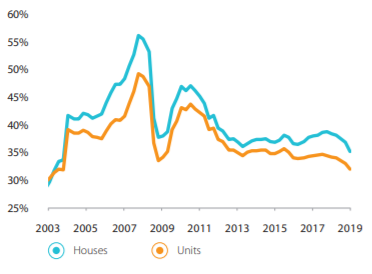
Share of income required for mortgage repayments. Source: CoreLogic
Share of income required for rent payments
The proportion of gross annual household income dedicated to renting has been steady in the year ending June 2019, at 28.5% (28.6% in June 2018), after trending lower from the high of 31.3% in June 2013.
CoreLogic attributed the healthy proportion of income dedicated to rent to national weekly rents rising just 2.4% a year over the past decade, while incomes have tracked 3.1% over the same time frame.
This stronger income growth has pushed the national rent to income ratio to its lowest level since 2007.
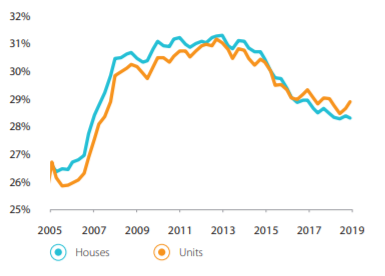
Share of income required for rent payments. Source: CoreLogic

Ready, Set, Buy!
Learn everything you need to know about buying property – from choosing the right property and home loan, to the purchasing process, tips to save money and more!
With bonus Q&A sheet and Crossword!


 Bea Garcia
 Denise Raward
 Harry O'Sullivan
 Harrison Astbury
 Rachel Horan