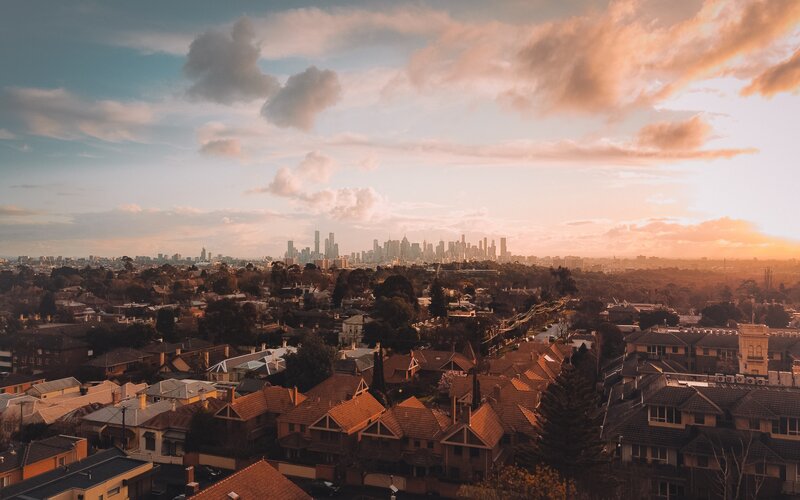
According to Domain, vacancy rates in inner-city Melbourne are at new record highs of 11.8%, as the city's rental market continues to feel the effects of prolonged COVD-19 lockdowns.
Melbourne's vacancy rate has now more than doubled compared to the same time last year at 4.6% in January - the highest of all the capitals according to Domain rental vacancy data released today.
The estimated number of vacant rentals in Melbourne has risen an astonishing 157.3% year-on-year, at just under 26,500 empty rentals.
Buying a home or looking to refinance? The table below features home loans with some of the lowest interest rates on the market for owner occupiers.
| Lender | Home Loan | Interest Rate | Comparison Rate* | Monthly Repayment | Repayment type | Rate Type | Offset | Redraw | Ongoing Fees | Upfront Fees | Max LVR | Lump Sum Repayment | Extra Repayments | Split Loan Option | Tags | Features | Link | Compare | Promoted Product | Disclosure |
|---|---|---|---|---|---|---|---|---|---|---|---|---|---|---|---|---|---|---|---|---|
5.54% p.a. | 5.58% p.a. | $2,852 | Principal & Interest | Variable | $0 | $530 | 90% |
| Promoted | Disclosure | ||||||||||
5.49% p.a. | 5.40% p.a. | $2,836 | Principal & Interest | Variable | $0 | $0 | 80% |
| Promoted | Disclosure | ||||||||||
5.64% p.a. | 5.89% p.a. | $2,883 | Principal & Interest | Variable | $250 | $250 | 60% |
| Promoted | Disclosure | ||||||||||
5.64% p.a. | 5.89% p.a. | $2,883 | Principal & Interest | Variable | $248 | $350 | 60% |
| Disclosure |
Domain's Senior Research Analyst Dr Nicola Powell said inner-city areas continue to have the highest vacancy rates.
"Renters may have the best chance of finding a new home in the Victorian suburbs of Whitehorse (West), Stonnington (East & West) and Melbourne City as these saw the highest rise in properties available for rent," Dr Powell said.
|
Highest vacancy rates across greater capital city areas – January 2021 |
|||||
| Rank | Sydney | Melbourne | Brisbane & Gold Coast | Perth | Adelaide |
| 1 | Parramatta, 4.8% | Melbourne City, 11.8% | Brisbane – Inner, 4.3% | Perth City, 1.4% | Adelaide City, 5.0% |
| 2 | Auburn, 4.2% | Stonnington – West, 8.3% | Sherwood – Indooroopilly, 4.3% | Cottesloe – Claremont, 1.1% | Holdfast Bay, 0.8% |
| 3 | Strathfield – Burwood – Ashfield, 4.1% | Stonnington – East, 8.1% | Brisbane Inner West, 3.6% | South Perth, 1.1% | Norwood – Payneham – St Peters, 0.8% |
| 4 | Pennant Hills – Epping, 3.8% | Whitehorse – West, 7.6% | Nathan, 2.7% | Canning, 1.0% | Prospect – Walkerville, 0.7% |
| 5 | Hornsby, 3.8% | Boroondara, 6.5% | Mt Gravatt, 2.5% | Belmont -Victoria Park, 0.8% | Burnside, 0.6% |
Source: Domain
Meanwhile, the rental market in Sydney has remained fairly flat over the year to end-January with a vacancy rate of 2.9% - the second highest of all the capital cities.
"Strong exposure to international border closures in Melbourne and Sydney will ensure significantly less demand for rentals for the foreseeable future, at least until international border restrictions are lifted," Dr Powell said.
The areas with the biggest rise in rental vacancies were Strathfield-Burwood-Ashfield, Kogarah- Rockdale, Auburn, Marrickville-Sydenham-Petersham and Eastern Suburbs-South.
Sydney-siders looking for a rental would have the most luck in Parramatta, with vacancy rates of nearly 5%.
See also: The rise of regional property in COVID-19
During the September quarter, a net 7,782 people left Sydney with three fifths of those moving to a regional part of NSW, according to the latest data from the Australian Bureau of Statistics (ABS).
Melbourne lost a net of 7,445 residents while the combined capital cities had a net loss of 11,200 people to regional areas - the biggest quarterly net loss on record.
The exodus from the capital cities to regional areas can also be seen in the Domain data. Nationally, vacancy rates slipped to 1.9% in January - the lowest vacancy rate since March 2020 just before the pandemic.
|
Capital city rental vacancy rates – January 2021 |
|||||
| City | Jan-21 | Dec-20 | Jan-20 | Monthly change | Annual change |
| Sydney | 2.9% | 3.9% | 2.9% | ↓ | – |
| Melbourne | 4.6% | 5.4% | 1.9% | ↓ | ↑ |
| Brisbane | 1.6% | 1.9% | 2.3% | ↓ | ↓ |
| Perth | 0.7% | 0.9% | 2.4% | ↓ | ↓ |
| Adelaide | 0.6% | 0.7% | 0.9% | ↓ | ↓ |
| Hobart | 0.4% | 0.5% | 0.6% | ↓ | ↓ |
| Canberra | 0.9% | 1.4% | 1.6% | ↓ | ↓ |
| Darwin | 0.8% | 1.1% | 4.2% | ↓ | ↓ |
| National | 1.9% | 2.4% | 2.0% | ↓ | ↓ |
Source: Domain
Dr Powell said it's pretty normal to see these kinds of figures at the start of a New Year.
"It is typical for the rental market to tighten in January following a seasonal boost of supply over December," she said.
"The end of the year marks the rental changeover period, as leases expire and choice lifts, before strong rental demand in January significantly reduces vacant rental listings in anticipation for the new year."
City slickers looking for a tree or sea change will have to battle it out for a rental property: the most tightly held regions in Australia continue to be scattered across smaller capital cities and lifestyle regions.
|
Lowest vacancy rates across capital city areas – January 2021 |
|||||
| Rank | Sydney | Melbourne | Brisbane & Gold Coast | Perth | Adelaide |
| 1 | Wyong, 0.3% | Mornington Peninsula, 0.3% | Nerang, 0.2% | Wanneroo, 0.2% | Marion, 0.2% |
| 2 | Camden, 0.3% | Yarra Ranges, 0.4% | Coolangatta, 0.2% | Kwinana, 0.3% | Port Adelaide – East, 0.2% |
| 3 | Gosford, 0.4% | Cardinia, 0.5% | Caboolture Hinterland, 0.3% | Stirling, 0.4% | Gawler – Two Wells, 0.2% |
| 4 | Blue Mountains, 0.5% | Nillumbik – Kinglake, 0.5% | Broadbeach – Burleigh, 0.3% | Swan, 0.4% | Tea Tree Gully, 0.2% |
| 5 | Richmond – Windsor, 0.6% | Casey – South, 0.7% | Strathpine, 0.4% | Gosnells, 0.4% | Playford, 0.3 |
Source: Domain

Ready, Set, Buy!
Learn everything you need to know about buying property – from choosing the right property and home loan, to the purchasing process, tips to save money and more!
With bonus Q&A sheet and Crossword!



 Brooke Cooper
 Harrison Astbury