With the economy placed into hibernation as a result of the pandemic, the property market has suffered like so many other sectors.
According to CoreLogic, the regions which have experienced the greatest decrease in dwelling values in May were Mandurah in Perth, and inner Melbourne and Sydney suburbs.
However, despite reports property prices could drop by as much as 30%, declines have been fairly mild so far.
Buying a home or looking to refinance? The table below features home loans with some of the lowest variable interest rates on the market for owner occupiers.
| Lender | Home Loan | Interest Rate | Comparison Rate* | Monthly Repayment | Repayment type | Rate Type | Offset | Redraw | Ongoing Fees | Upfront Fees | Max LVR | Lump Sum Repayment | Extra Repayments | Split Loan Option | Tags | Features | Link | Compare | Promoted Product | Disclosure |
|---|---|---|---|---|---|---|---|---|---|---|---|---|---|---|---|---|---|---|---|---|
5.54% p.a. | 5.58% p.a. | $2,852 | Principal & Interest | Variable | $0 | $530 | 90% |
| Promoted | Disclosure | ||||||||||
5.49% p.a. | 5.40% p.a. | $2,836 | Principal & Interest | Variable | $0 | $0 | 80% |
| Promoted | Disclosure | ||||||||||
5.64% p.a. | 5.89% p.a. | $2,883 | Principal & Interest | Variable | $250 | $250 | 60% |
| Promoted | Disclosure | ||||||||||
5.64% p.a. | 5.89% p.a. | $2,883 | Principal & Interest | Variable | $248 | $350 | 60% |
| Disclosure |


")

Nationally, the CoreLogic May home value index showed the dwelling market declined just 0.4% over the month, and preliminary indicators for June were showing the rate of decline has gathered some momentum through the month.
CoreLogic Head of Research Eliza Owen said the Australian housing market wasn't one market but a collection of many.
" Over the past few months, dwelling market performance has varied by region, in both a cyclical and structural way," Ms Owen said.
"As per historic cycles, the most expensive parts of Sydney and Melbourne seem to be leading the current downswing."
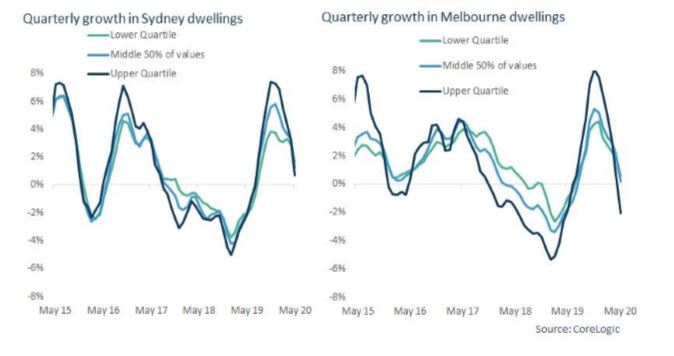
Over the month of May, dwelling values in the top quartile of the Melbourne market (dwellings worth $959,500 or more) had fallen by 1.3%, compared with a 0.6% decline across the middle of the market, and a 0.3% decline in the lowest-value quartile.
Across Sydney, the same period saw a decline in the highest market segment (where dwellings are worth over $1.35 million) of 0.6%, followed by a 0.4% decline across the middle of the market, and a slight increase in the lowest value segment of 0.1%.
Ms Owen said the more expensive parts of Sydney and Melbourne have higher levels of volatility, and typically the first to see price changes.
"Research from the RBA asserts that more expensive property can be most reactive and volatile in responses to changes in the cash rate," she said.
"The performance of property markets amid COVID-19 suggest the high end of the market may also be more responsive to negative economic shocks."
Perth, Melbourne and Sydney property prices worst hit
Suburbs in Melbourne's inner city and eastern suburbs saw the largest decline across the metropolitan region, according to CoreLogic.
The last two months have also seen a decline in values in high-end Sydney markets, such as North Sydney, the Inner West and the Northern Beaches.
Maybe more surprising was the continued decline in the Greater Perth region of Mandurah, which saw the largest slip in values over the last two months.
Ms Owen said Mandurah dwelling values were 38% below their 2006 peak at the end of May this year.
"Payroll data analysis from the ABS suggests that payroll job losses across Mandurah has been 6.0% between mid-march and the end of May," Ms Owen said.
"This is not especially severe when it comes to job loss across Perth regions, nor would Mandurah have been particularly susceptible to a demand shock from a decline in overseas migration.
"However, the decline in dwelling values is off the back of a longer-term downward trend, suggesting demand conditions were already fragile across the region."
Property markets most negatively impacted by COVID-19
|
Capital city region |
Region |
Change in value - May |
|
Greater Perth |
Mandurah |
-2.2% |
|
Greater Melbourne |
Melbourne – Inner South |
-2.2% |
|
Greater Melbourne |
Melbourne- Inner |
-1.8% |
|
Greater Melbourne |
Melbourne – Inner East |
-1.8% |
|
Greater Perth |
Perth – South East |
-1.2% |
|
Greater Melbourne |
Melbourne – Outer East |
-1.2% |
|
Greater Brisbane |
Ipswich |
-0.8% |
|
Greater Sydney |
Sydney – North Sydney and Hornsby |
-0.7% |
|
Greater Sydney |
Sydney – Inner West |
-0.7% |
|
Greater Sydney |
Sydney – Northern Beaches |
-0.7% |
Source: CoreLogic.
At a suburb level, the worst hit areas were most prevalent in the high end of Sydney and Melbourne.
Ms Owen said at this stage, sound analysis of the change in suburb-level dwelling markets was limited to areas where there are relatively high sales observations.
"It appears that Malvern East, in the Melbourne metropolitan, has been the worst suburb-level performer between the end of March and the end of May across the capital cities, with total dwelling market values down -4.8%," she said.
"Other relatively steep value falls have been seen across the Melbourne suburbs of Glen Iris (-3.8%), Northcote (-3.5%), Port Melbourne (-3.2%), and Brunswick East (-3.1%).
"Across Sydney, the biggest suburb-level falls in dwelling values had occurred across Mosman (-2.5%), Lane Cove North (-2.4%) Manly (-2.3%), Leichhardt (-1.7%) and Wentworth Point (-1.4%)."
Ms Owen said as the downturn progressed, declines would continue in inner-city markets which relied on international migration.
As the economic downturn becomes more prolonged, mild price declines are expected to spread over the next 12 months.

Ready, Set, Buy!
Learn everything you need to know about buying property – from choosing the right property and home loan, to the purchasing process, tips to save money and more!
With bonus Q&A sheet and Crossword!


 Bea Garcia
 Denise Raward
 Harry O'Sullivan
 Rachel Horan
 Alex Brewster