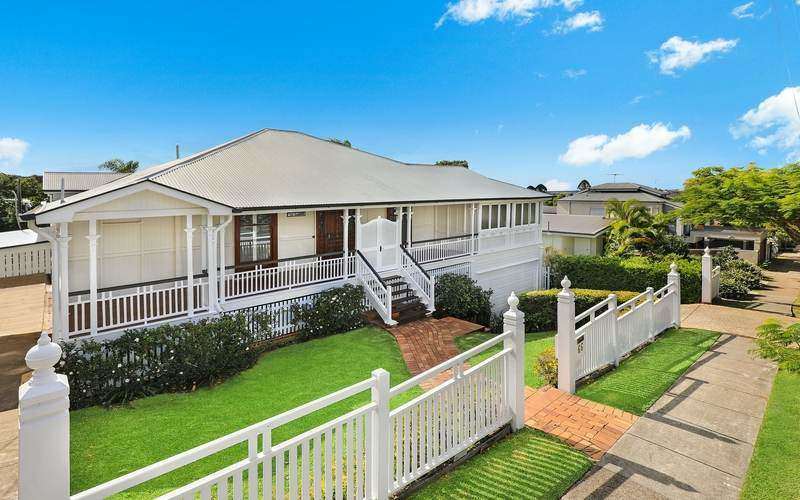
The concept of rentvesting has gained momentum recently with house prices surging and many not wanting to sacrifice location and lifestyle just to break into the property market.
Rentvesting is the process of buying and renting out an investment property while living in a rental property yourself.
The idea is you get your foot on the property ladder, while living in a suburb that suits your wants and needs.
Data from research firm Suburbtrends has identified the areas around Australia offering growth potential and good cashflow for a budget of between $600,000 to $800,000.
Additionally, the report has identified the inner city areas where renting is affordable due to higher vacancy rates.
The suburbs below rank as the top 30 for investors looking to rent inner city, and buy in a high growth region according to Well Home Loans.
10 suburbs to buy with a budget of $500,000-$600,000
| Rank | State | Area | Median Yield for Houses | Median Vacancy Rate for Houses | Median sale price range for houses |
| 1 | QLD | Cairns-North | 5.2% | 5.0% | $425k to $825k |
| 2 | WA | Augusta-Margaret River-Busselton | 4.9% | 3.6% | $400k to $585k |
| 3 | QLD | Cleveland-Stradbroke | 4.5% | 6.8% | $600k to $780k |
| 4 | NT | Litchfield | 4.4% | 4.7% | $600k to $740k |
| 5 | QLD | North Lakes | 4.4% | 7.1% | $475k to $620k |
| 6 | SA | Port Adelaide - East | 4.4% | 8.2% | $450k to $590k |
| 7 | WA | Cockburn | 4.4% | 9.3% | $430k to $700k |
| 8 | NSW | Orange | 4.3% | 3.8% | $387k to $540k |
| 9 | QLD | Capalaba | 4.3% | 5.2% | $545k to $720k |
| 10 | QLD | Redcliffe | 4.3% | 7.0% | $490k to $735k |
Source: Suburbtrends, Well Home Loans
10 suburbs to buy with a budget of $600,000-$700,000
| Rank | State | Area | Median Yield for Houses | Median Vacancy Rate for Houses | Median sale price range for houses |
| 1 | QLD | Nerang | 4.2% | 2.8% | $550k to $770k |
| 2 | QLD | Nambour | 4.2% | 2.9% | $495k to $910k |
| 3 | NSW | Port Macquarie | 4.2% | 3.9% | $490k to $750k |
| 4 | QLD | Bald Hills- Everton Park | 4.2% | 5.5% | $560k to $852k |
| 5 | NSW | Coffs Harbour | 4.2% | 5.2% | $470k to $945k |
| 6 | WA | Joondalup | 4.1% | 7.0% | $485k to $865k |
| 7 | TAS | Hobart - North East | 4.1% | 7.5% | $370k to $785k |
| 8 | QLD | Ormeau - Oxenford | 4.0% | 4.4% | $545k to $915k |
| 9 | QLD | Sunshine Coast Hinterland | 3.9% | 3.5% | $571k to $880k |
| 10 | QLD | Nundah | 3.8% | 8.5% | $600k to $826k |
Source: Suburbtrends, Well Home Loans
10 suburbs to buy with a budget of $700,000-$800,000
| Rank | State | Area | Median Yield for Houses | Median Vacancy Rate for Houses | Median sale price range for houses |
| 1 | QLD | Southport | 4.2% | 9.5% | $675k to $720k |
| 2 | NSW | Queanbeyan | 4.1% | 3.0% | $630k to $890k |
| 3 | QLD | Buderim | 4.0% | 5.9% | $600k to $830k |
| 4 | ACT | Tuggeranong | 4.0% | 5.5% | $675k to $807k |
| 5 | ACT | Belconnen | 3.8% | 7.5% | $670k to $965k |
| 6 | QLD | Wynnum - Manly | 3.8% | 6.9% | $630k to $855k |
| 7 | QLD | The Gap-Enoggera | 3.7% | 9.1% | $645k to $830k |
| 8 | QLD | Caloundra | 3.7% | 6.3% | $515k to $920k |
| 9 | QLD | The Hills District | 3.7% | 2.6% | $600k to $830k |
| 10 | QLD | Gold Coast - North | 3.6% | 5.5% | $520k to $900k |
Source: Suburbtrends, Well Home Loans
Why are those areas regarded as locations to consider buying a house?
These are areas where upwards pressure is being placed on weekly rents and property prices.
The criteria focusses on three data points:
- Vacancy rates are below 1.5%
- Rental yields are above 3.5%
- Inventory levels are less than five months
Inventory levels refers to how long it would take for all inventory to be sold, provided no more dwellings are added to the market.
These factors mean rentvestors have an opportunity to rent out their investment property whilst it gains capital value.
The report also highlights where rentvesters may look to live themselves while they rent out their property.
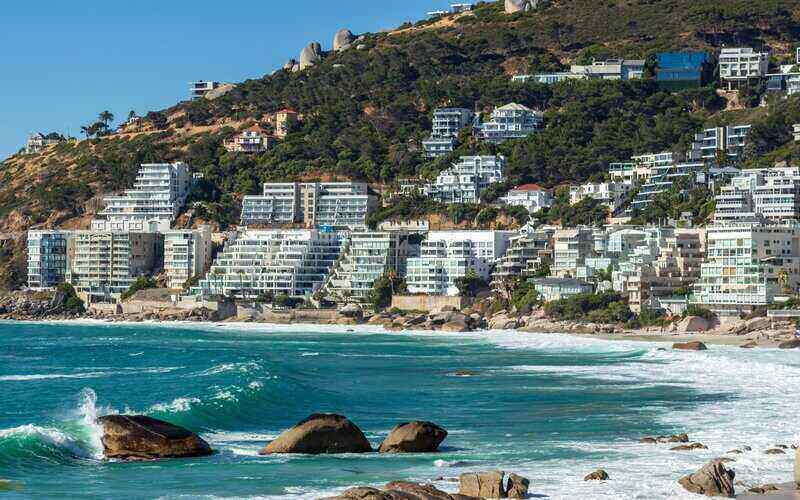
Where is it better to rent than buy?
The report also identified areas where downward pressure is being placed on weekly rent and property prices.
The report focused on three main data points to identify these rental markets:
- Vacancy rates are above 1%
- Yields are below 5%
- Over the previous 10 years, median prices for units have grown at less than half the rate of houses.
NSW
- Parramatta
- Canterbury
- Blacktown
- Newcastle
- Tweed Valley
VIC
- Melbourne City
- Essendon
- Brunswick
- Casey-North
- Stonnington-West
QLD
- Brisbane Inner-East
- Broadbeach-Burleigh
WA
- Fremantle
- South Perth
- Melville
- Cottesloe-Claremont
ACT
- South Canberra
TAS
- Hobart Inner
Image by Grant Durr via Unsplash

Ready, Set, Buy!
Learn everything you need to know about buying property – from choosing the right property and home loan, to the purchasing process, tips to save money and more!
With bonus Q&A sheet and Crossword!


 Harry O'Sullivan
 Bea Garcia
 Denise Raward
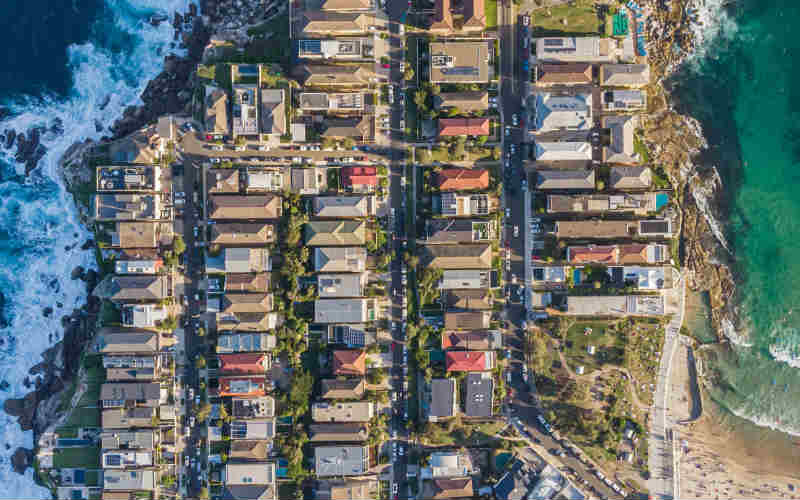
 Emma Duffy
 William Jolly