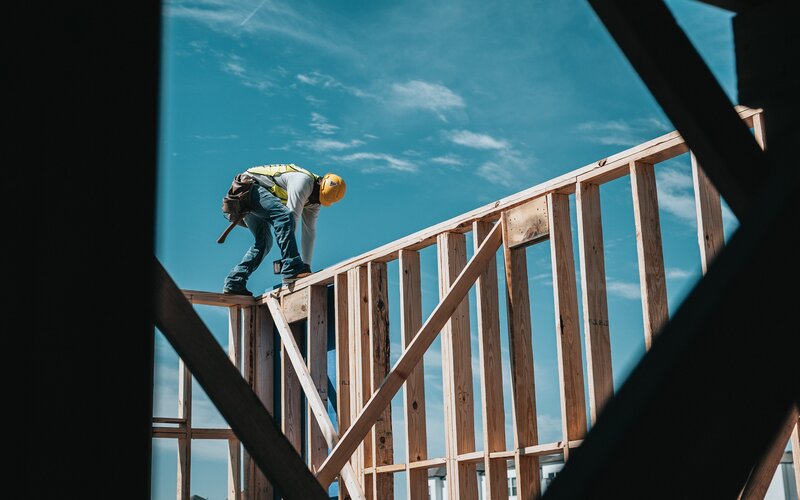
"We are seeing a record number of detached homes commence construction while at the same time, apartment construction is in the midst of a significant slump," HIA chief economist Tim Reardon said.
"In this market, it is not surprising that detached home builders have dominated the list of the most active home builders in Australia."
Mr Reardon attributes the downturn of new apartments being built to the loss of overseas migration.
"Overseas students, tourists and migrants often stay in multi-unit dwellings when they first arrive in the country," he said.
"This trend was exacerbated by the shift in consumer preferences towards lower density housing."
The data comes in lieu of the HIA releasing its 'Housing 100' report, revealing Metricon was ranked the number one residential builder in the country.
Metricon reported 6,052 builds, with 5,820 of that being detached housing.
The minimum number of homes built to make it into the top 100 rose from 108 to 125 - the largest uptick in 28 years, according to the report.
Over the last year, revenue earned from home construction rose 31.4% to $31.7 billion.
The HIA puts data down to announcement of HomeBuilder pulling foward demand.
According to CoreLogic data, the June 2021 quarter saw construction costs rise 1.4%, with an annual growth rate of 3.9% - the highest annual growth rate since 2014 when it was 1.5%.
Housing market buoyancy caused by bumper housing credit growth
On Wednesday RBA Financial System Assistant Governor, Michele Bullock, made an address today regarding house prices and financial stability.
"The strength in the housing market is positive for the economy, and indeed an important channel for monetary policy to support the economy through housing construction, home improvements and purchases of household items," Ms Bullock said.
However, she warned that the nation's debt to income ratio is high both historically and relative to other countries.
"So sustained strong growth in credit in excess of income growth may result in vulnerabilities building in bank and household balance sheets," Ms Bullock said.
She said despite 'moderation' during Victorian and NSW lockdowns, the housing market's strength has been 'broad', particularly in detached housing.
"In this environment it is unsurprising that housing credit growth has picked up and the rapid rebound in loan commitments suggests some further pickup in growth to come," she said.
Growth in housing is currently running at 7% annually, but recent data on commitments, combined with forecasts could see housing credit peak at 11% early next year, according to Ms Bullock.
Ms Bullock named factors driving this strength, including low interest rates and government support for housing construction.
While Ms Bullock said the HomeBuilder scheme drove housing credit in late 2020 and early 2021, there are recent signs credit is being increasingly driven by purchasing existing dwellings.
Advertisement
Building a home? This table below features construction loans with some of the lowest interest rates on the market.
| Lender | Home Loan | Interest Rate | Comparison Rate* | Monthly Repayment | Repayment type | Rate Type | Offset | Redraw | Ongoing Fees | Upfront Fees | Max LVR | Lump Sum Repayment | Extra Repayments | Split Loan Option | Tags | Features | Link | Compare | Promoted Product | Disclosure |
|---|---|---|---|---|---|---|---|---|---|---|---|---|---|---|---|---|---|---|---|---|
5.93% p.a. | 6.19% p.a. | $2,471 | Interest-only | Variable | $0 | $530 | 90% |
| Promoted | Disclosure | ||||||||||
5.69% p.a. | 5.71% p.a. | $2,899 | Principal & Interest | Variable | $0 | $350 | 80% | Disclosure | ||||||||||||
5.94% p.a. | 6.00% p.a. | $2,475 | Interest-only | Variable | $0 | $835 | 90% | |||||||||||||
6.24% p.a. | 6.31% p.a. | $2,600 | Interest-only | Variable | $0 | $450 | 80% | |||||||||||||
6.44% p.a. | 6.41% p.a. | $2,683 | Interest-only | Variable | $0 | $530 | 90% | |||||||||||||
6.74% p.a. | 7.51% p.a. | $2,808 | Interest-only | Variable | $20 | $644 | 90% | |||||||||||||
7.89% p.a. | 8.22% p.a. | $3,631 | Principal & Interest | Variable | $0 | $0 | 75% | |||||||||||||
7.19% p.a. | 6.90% p.a. | $2,996 | Interest-only | Variable | $0 | $1,212 | 90% | |||||||||||||
8.18% p.a. | 8.25% p.a. | $3,732 | Principal & Interest | Variable | $0 | $900 | 80% | |||||||||||||
5.94% p.a. | 6.36% p.a. | $2,978 | Principal & Interest | Variable | $395 | $null | 95% | |||||||||||||
5.18% p.a. | 5.63% p.a. | $2,739 | Principal & Interest | Variable | $350 | $0 | 90% |

Ready, Set, Buy!
Learn everything you need to know about buying property – from choosing the right property and home loan, to the purchasing process, tips to save money and more!
With bonus Q&A sheet and Crossword!









 Denise Raward
 Harry O'Sullivan