
In today's total value of dwellings release, the ABS estimated Australia's mean residential property price at $881,200 for the December 2022 quarter.
This is a quarterly decline of $28,700, and marks a drop of more than 8% since June, where the average property price was $961,100.
This generally corroborates CoreLogic's declaration it had observed a 6.9% decline to property prices from April to November, the fastest rate of decline since records began in 1980.
If 2023 sees a further drop of up to 10%, this could see the mean property price fall below $800,000 for the first time since March 2021.
The start of this month saw CoreLogic indicate property prices had began to stabilise in February, although research Director Tim Lawless was quick to downplay the significance of this.
"Considering the RBA's move to a more hawkish stance at the February board meeting, along with an expectation for a weaker economic performance and a loosening in labour markets, there is a good chance this reprieve in the housing downturn could be short-lived," Mr Lawless said at the time.
Since then of course, the Reserve Bank has increased the cash rate by another 25 basis points, in line with the broad consensus that peak is likely to reach above 4%.
High interest rates tend to put downward pressure on the property market, and the number of further increases to the cash rate is likely to be a big factor in determining how far property prices fall.
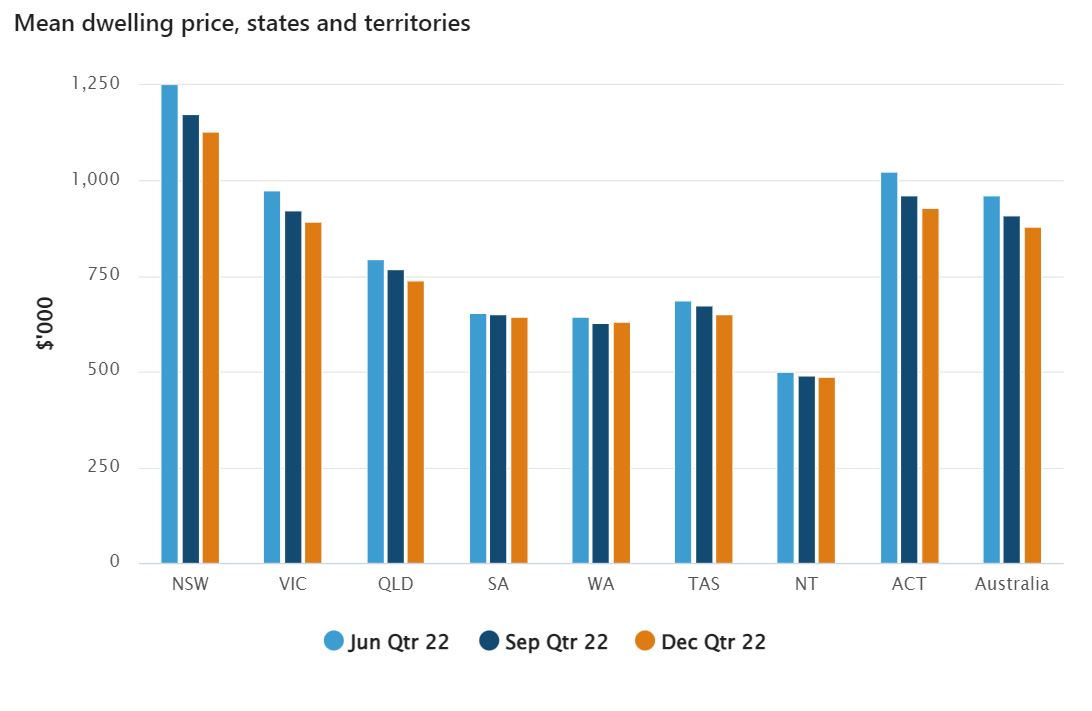
Average state residential prices
NSW remains the only state with a mean property price over $1 million ($1.13 million), despite a decline of over $40,000.
This continues to more than double the NT, where the mean price was just $488,200 in December, a $1,800 decline and the cheapest in the nation.
There was a quarterly decline to the mean price for all states, except WA, which saw a slight $1,000 increase.
Slight uptick to housing supply
The ABS also revealed the number of residential dwellings rose by 45,500 to reach over 10.9 million, a quarterly increase of just over 0.4%.
This is the largest jump since September 2019, timely considering the surge in migration post-Covid.
However, the most recent building approvals data showed a steep decline in the number of new dwellings approved since September 2022.
Housing Industry Association chief economist Tim Reardon said loans for the construction and purchase of new homes are at the lowest levels since the Global Financial Crisis.
“The higher cash rate is compounding the adverse impact of the rising cost of materials, labour and land as well as the increased costs of compliance due to changes to the building code," Mr Reardon said.
“There remains a large volume of work underway that will be completed in 2023 which is obscuring the adverse impact of rate rises on other indicators such as unemployment and economic growth."
Advertisement
Buying a home or looking to refinance? The table below features home loans with some of the lowest interest rates on the market for owner occupiers.
| Lender | Home Loan | Interest Rate | Comparison Rate* | Monthly Repayment | Repayment type | Rate Type | Offset | Redraw | Ongoing Fees | Upfront Fees | Max LVR | Lump Sum Repayment | Extra Repayments | Split Loan Option | Tags | Features | Link | Compare | Promoted Product | Disclosure |
|---|---|---|---|---|---|---|---|---|---|---|---|---|---|---|---|---|---|---|---|---|
5.54% p.a. | 5.58% p.a. | $2,852 | Principal & Interest | Variable | $0 | $530 | 90% |
| Promoted | Disclosure | ||||||||||
5.49% p.a. | 5.40% p.a. | $2,836 | Principal & Interest | Variable | $0 | $0 | 80% |
| Promoted | Disclosure | ||||||||||
5.64% p.a. | 5.89% p.a. | $2,883 | Principal & Interest | Variable | $250 | $250 | 60% |
| Promoted | Disclosure | ||||||||||
5.64% p.a. | 5.89% p.a. | $2,883 | Principal & Interest | Variable | $248 | $350 | 60% |
| Disclosure |


")

Picture by Mei Mei on Unsplash

Ready, Set, Buy!
Learn everything you need to know about buying property – from choosing the right property and home loan, to the purchasing process, tips to save money and more!
With bonus Q&A sheet and Crossword!


 Harry O'Sullivan

 Denise Raward
 William Jolly

