With the exception of Darwin, every capital city recorded a softer fall in property prices than January, with Sydney even seeing prices go up by 0.3%.
While it remains the tenth month in a row property prices have fallen, the numbers show the rate of decline slowing significantly, potentially suggesting the market is stabilising.
This would contradict the broad consensus among experts that property prices will fall as much as 10% over 2023.
The total volume of listings recorded in the four weeks ending 26 February was about 143,500, down 26.3% on the five year average which could go some way to explaining how prices have held up.
"It seems prospective vendors are prepared to wait this downturn out," CoreLogic's research Director Tim Lawless said.
February was also a good month for clearance rates, with the weighted capital city average auction clearance rate increasing to reach nearly 70% in the second half of the month.
In Sydney, clearance rates rose above 70% in the week ending February 19th, for the first time in a year.
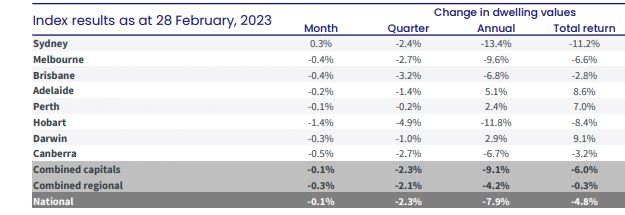
Data by CoreLogic
Is this a turning point?
The February data will encourage many that continual cash rate rises might not mean the value of their home bottoms out dramatically.
In January, the national index fell 1%, but even this was a slowing in the rate of decline.
Mr Lawless though was careful to clarify that it remains difficult to tell whether this is merely a blip in an otherwise downward trajectory or the market has truly turned a corner.
“Considering the RBA’s move to a more hawkish stance at the February board meeting, along with an expectation for a weaker economic performance and a loosening in labour markets, there is a good chance this reprieve in the housing downturn could be short-lived,” Mr Lawless said.
“We also have the fixed-rate cliff ahead of us; arguably the full impact of the aggressive rate hiking cycle is yet to play out.”
Many of these people will have began their fixed terms with interest rates at record lows, so will be bracing themselves for far higher repayments when they come to refinance.
This could mean more people need to sell their property, or even default on their mortgage, which could have severe effects on property prices.
AMP Chief Economist Dr Shane Oliver is one analyst who has been consistent that 2023 will see prices fall significantly.
He says that February's stablisation does not change his prediction.
"We are a bit sceptical and our base case remains for a top to bottom fall of 15-20% in prices with about another 8% or so to go out to around the September quarter," Dr Oliver said.
His explanation was that February had likely seen bargain hunters taking advantage of the extent property prices have already fallen.
Coming into the new year, many believed the cash rate was close to peaking, and that we would see rate cuts in the second half of the year which could see prices rise.
Mr Oliver speculated that this could have led to 'FOMO (fear of missing out) investing,' as investors scrambled to get in before an upswing.
February's cash rate announcement though and the increasingly hawkish tone of the RBA has seen many analysts scramble to upwardly revise their terminal predictions.
Economists at three of Australia's big four banks now expect the cash rate to breach 4%, and to remain above the 3% mark for the end of the year.
However, Westpac created headlines over the past few days as economists forecast seven cash rate cuts between 2024 and 2025, which could induce demand again.
As Mr Oliver points out, historical evidence suggests rate cuts are necessary before a declining Australian property market can substantially reverse course.
"The last two major upswings in property prices that started in 2012 and 2019 required rate cuts before prices started to rise," Mr Oliver said.
"It's worth noting that the 2010-12 and 2017-19 price fall cycles saw periods where falls moderated or partially reversed only to resume falling."
Vendors still optimistic about asking prices
SQM Research data released Tuesday shows vendors' asking prices are still stable when compared to 12 months ago.
Sydney house asking prices remain just 3.9% below their levels 12 months ago, at just over $1.7 million.
At the national level, house asking prices are up 0.3% to a tick over $1.2 million across the capital cities.
Brisbane's are up 7.8% to $947,130, despite being one of the cities to record the sharpest price declines.
Photo by Tom Rumble on Unsplash

Ready, Set, Buy!
Learn everything you need to know about buying property – from choosing the right property and home loan, to the purchasing process, tips to save money and more!
With bonus Q&A sheet and Crossword!


 Harry O'Sullivan
 Brooke Cooper