The ANZ CoreLogic Housing Affordability Report revealed renters are handing over nearly one-third of their income to pay rent on a new lease as surging demand and falling supply fuel record breaking rental price increases.
This means the average household is now in rent stress.
Low-income households bore the brunt of the deteriorating affordability; those in the 25th percentile income level are dishing out 51.6% of their income to pay rent.
This is up from 44% before the pandemic.
This officially puts this cohort in 'extreme' housing stress.
ANZ Senior Economist Felicity Emmett said no household is safe from the current rental market pressures.
“Heightened economic uncertainty has seen a decline in sales volumes in the private market and an increase in those seeking rental accommodation,” Ms Emmett said.
“Paired with a decline in social housing, rental demand pressures are being felt in all income brackets.”
Perth recorded the fastest deterioration in rental affordability for low-income households since the start of the pandemic, lifting from 39% of income required to 51.7% as of March this year.
Rental conditions for low-income earners in Adelaide and Brisbane also declined rapidly, with the portion of income needed to pay rent climbing to 55.1% and 50.9% respectively.
Meanwhile, those in Hobart needed almost 60% of their income to pay rent, the highest across all capital cities.
CoreLogic Head of Research Eliza Owen said some low-income households have been forced to seek out government supported housing or even to turn to homelessness provisions.
“In reality, low-income households may not be able to pay for rentals,” Ms Owen said.
“As rental affordability has deteriorated, an increasing number of people have had to turn to over-crowded or insecure options for shelter.
“A recent report by the Productivity Commission found that in 2020-21, around 114,000 requests for specialist homelessness services went unassisted, up around 20% from 2016-17.”
Low-income households renting: Before and after the pandemic
| Income directed to rent - March quarter 2020 | Income directed to rent - March quarter 2023 | |
| Sydney | 48.1% | 52.5% |
| Melbourne | 44.4% | 44.3% |
| Brisbane | 41.4% | 50.9% |
| Adelaide | 45.3% | 55.1% |
| Perth | 39% | 51.7% |
| Hobart | 54.8% | 59.8% |
| Darwin | 30.9% | 37.9% |
| ACT | 39.7% | 40.9% |
| Australia | 44.7% | 51.6% |
Source: CoreLogic portion of income to service new rent for low-income households
Recent PropTrack data showed rents have soared as much as $600 per week over the past year in some suburbs, while the share of rentals listed for $400 or less has almost halved in the past year.
As of April 2023, rental vacancy rates sat at 1.1% nationally, below the decade average of 3%. In the same period, total rent listings are 38.1 per cent below the previous decade average.
Sydney most unaffordable market for home ownership
Once again, Sydney takes the crown as the most unaffordable market for home ownership.
Homebuyers needed 51.6% of income to service a new mortgage, and around 12 years to accumulate a 20% deposit.
In Melbourne, homeowners spent 50% of income on their mortgage; Brisbane, 47.5%; Adelaide, 33.7%; and Perth, 47.4%.
Advertisement
Buying a home or looking to refinance? The table below features home loans with some of the lowest interest rates on the market for owner occupiers.
| Lender | Home Loan | Interest Rate | Comparison Rate* | Monthly Repayment | Repayment type | Rate Type | Offset | Redraw | Ongoing Fees | Upfront Fees | Max LVR | Lump Sum Repayment | Extra Repayments | Split Loan Option | Tags | Features | Link | Compare | Promoted Product | Disclosure |
|---|---|---|---|---|---|---|---|---|---|---|---|---|---|---|---|---|---|---|---|---|
5.54% p.a. | 5.58% p.a. | $2,852 | Principal & Interest | Variable | $0 | $530 | 90% |
| Promoted | Disclosure | ||||||||||
5.49% p.a. | 5.40% p.a. | $2,836 | Principal & Interest | Variable | $0 | $0 | 80% |
| Promoted | Disclosure | ||||||||||
5.64% p.a. | 5.89% p.a. | $2,883 | Principal & Interest | Variable | $250 | $250 | 60% |
| Promoted | Disclosure | ||||||||||
5.64% p.a. | 5.89% p.a. | $2,883 | Principal & Interest | Variable | $248 | $350 | 60% |
| Disclosure |
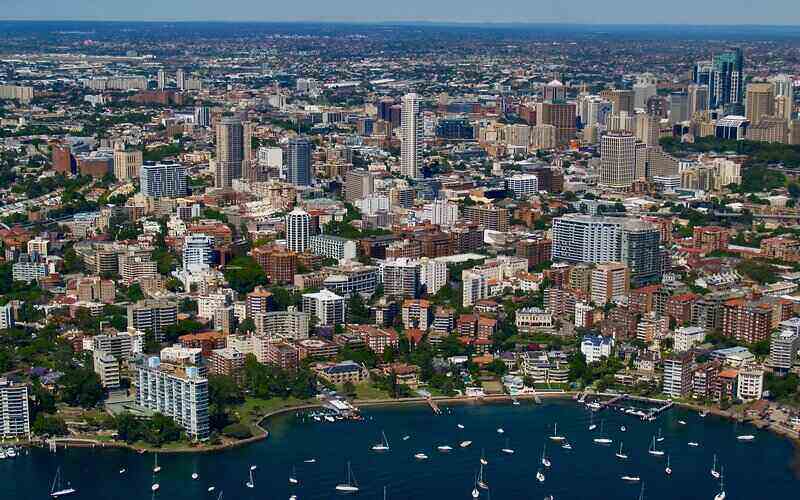
Image by Peter Burdon via Unsplash

Ready, Set, Buy!
Learn everything you need to know about buying property – from choosing the right property and home loan, to the purchasing process, tips to save money and more!
With bonus Q&A sheet and Crossword!


