
Australia's housing market boom has been well documented throughout the pandemic, but insights from international agency Knight Frank puts it into perspective.
The report focused on the second quarter of 2021, and evaluated annual price growth of 55 different countries.
Australia was outpaced, in order, by: Turkey, New Zealand, United States, Slovakia, Sweden, and Luxembourg.
It should be noted annual inflation in Turkey hit 19.25% in August.
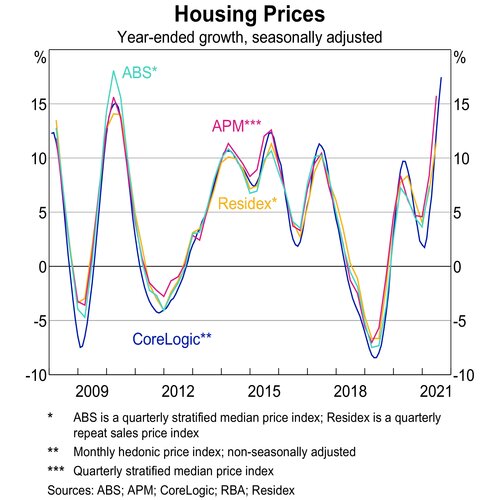
Australia's property price growth of 16.4% for the year ending in June puts the annual pace at its most rapid since 2003 and the average house price at its highest since 2009.
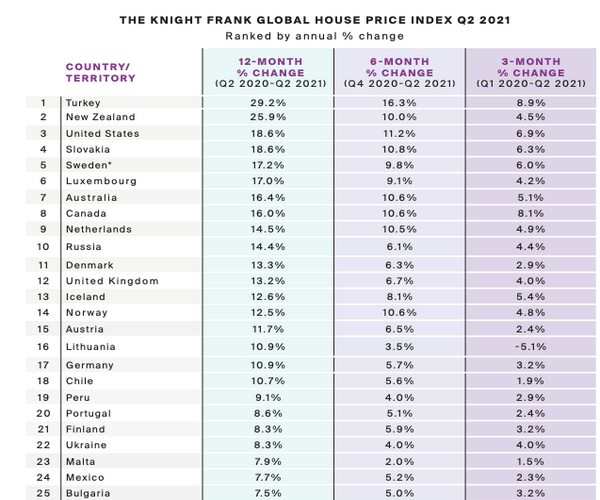
Source: Knight Frank
Australia is up from 18th position in the previous quarter.
Michelle Ciesielski, Head of Residential Research at Knight Frank Australia, said that the growth is consistent across all of Australia.
"Analysis of the Australian residential market often acknowledges inconsistencies from city-to-city, but currently we are seeing consistent double-digit annual growth in each capital city, although underlying factors do differ as you dive into each market," Ms Ciesielski said.
"A comparison at the end of June 2021 revealed that every capital city in Australia recorded an upward trajectory in annual sales volume, with a 30% average, whilst the number of days a property was listed on the market has fallen by 24% over the past year.
"This is equivalent to having almost a month (29 days) shaved off the average Australian property listing.
"We are experiencing more activity in the smaller capital cities driving up this Australian residential growth."
See also:
The report highlights the pandemic-induced housing boom continues to be a global trend, with prices rising by 9.2% on average across 55 countries and territories in the year to June 2021.
In total, 18 markets registered double-digit price growth, up from 13 last quarter and seven countries a year ago.
The report emphasised the consistent impact of low interest rates in many of the countries featured.
Globally, house prices are growing at their strongest rate since 2005.
Advertisement
Buying a home or looking to refinance? The table below features home loans with some of the lowest interest rates on the market for owner occupiers.
| Lender | Home Loan | Interest Rate | Comparison Rate* | Monthly Repayment | Repayment type | Rate Type | Offset | Redraw | Ongoing Fees | Upfront Fees | Max LVR | Lump Sum Repayment | Extra Repayments | Split Loan Option | Tags | Features | Link | Compare | Promoted Product | Disclosure |
|---|---|---|---|---|---|---|---|---|---|---|---|---|---|---|---|---|---|---|---|---|
5.54% p.a. | 5.58% p.a. | $2,852 | Principal & Interest | Variable | $0 | $530 | 90% |
| Promoted | Disclosure | ||||||||||
5.49% p.a. | 5.40% p.a. | $2,836 | Principal & Interest | Variable | $0 | $0 | 80% |
| Promoted | Disclosure | ||||||||||
5.64% p.a. | 5.89% p.a. | $2,883 | Principal & Interest | Variable | $250 | $250 | 60% |
| Promoted | Disclosure | ||||||||||
5.64% p.a. | 5.89% p.a. | $2,883 | Principal & Interest | Variable | $248 | $350 | 60% |
| Disclosure |


")

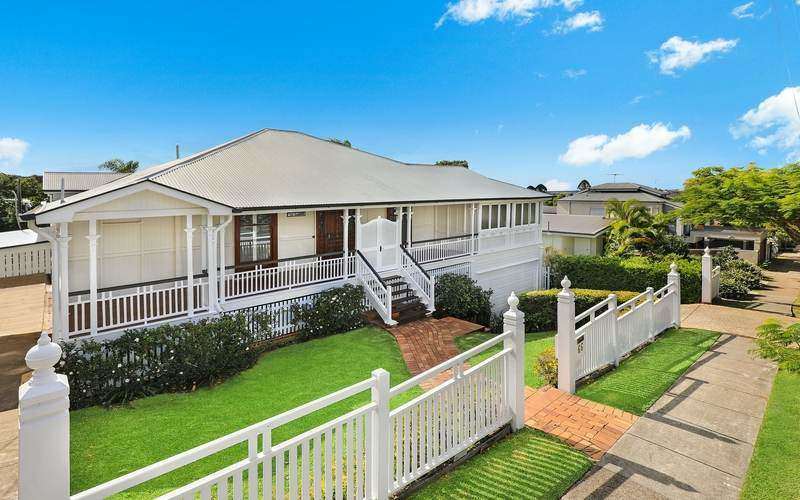
Image by Jake Charles via Unsplash

Ready, Set, Buy!
Learn everything you need to know about buying property – from choosing the right property and home loan, to the purchasing process, tips to save money and more!
With bonus Q&A sheet and Crossword!


 Denise Raward
 Harry O'Sullivan
 Rachel Horan
 Harrison Astbury