The Domain House Price report showed the rate of growth is slowing in Australia's three most expensive capital cities, whilst Brisbane, Hobart and Adelaide all continued to rise over the most recent quarter.
According to the report, Sydney house prices are 0.2% higher over the quarter to $1.59 million, showing the weakest outcome since prices declined in the June quarter of 2020.
"Sydney’s housing market slowdown became more apparent over the first quarter of 2022," the report said.
"House prices flatlined and unit prices declined to provide the weakest outcome since the June quarter of 2020 and one of the most significant slowdowns in all the capital cities."
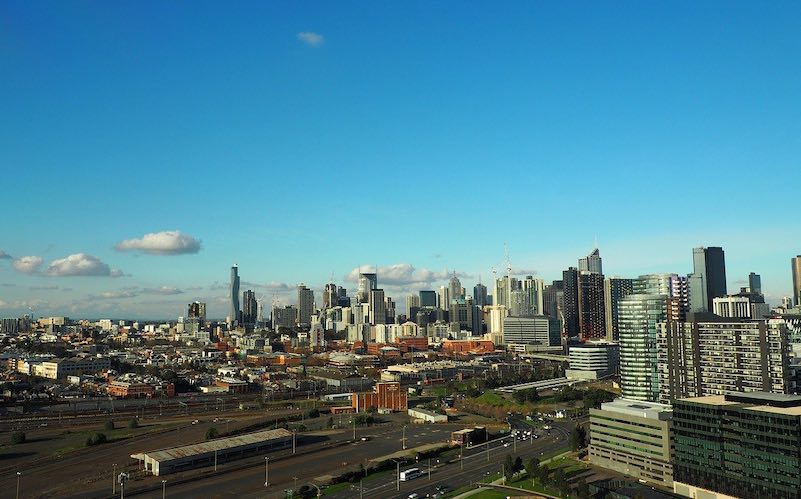
In Melbourne, house prices decreased by 0.7% over the quarter to $1.09 million, it is the first decline since the June quarter of 2020.
In Canberra, house prices declined 0.9% over the quarter to just over $1.12 million. This is the first time house prices have fallen over a quarter since March 2020 - however they are still 21.1% higher than the same time last year.
Median House Price
| City | March-22 | Dec-21 | March-21 | Quarterly Change | Annual Change |
| Sydney | $1,590,932 | $1,588,423 | $1,314,383 | +0.2% | +21.0% |
| Melbourne | $1,092,144 | $1,099,419 | $981,401 | -0.7% | +11.3% |
| Brisbane | $831,346 | $806,117 | $629,499 | +3.1% | +32.1% |
| Adelaide | $750,084 | $728,342 | $585,384 | +3.0% | +28.1% |
| Canberra | $1,124,952 | $1,134,678 | $929,201 | -0.9% | +21.1% |
| Perth | $622,030 | $612,926 | $592,537 | +1.5% | +5.0% |
| Hobart | $758,141 | $727,099 | $604,103 | +4.3% | +25.5% |
| Darwin | $635,389 | $647,156 | $543,246 |
-1.8%
|
+17.0% |
| National | $1,069,289 | $1,062,537 | $902,829 | +0.6% | +18.4% |
Source: Domain
More affordable markets surge on
While the nation's three most expensive markets have slowed over the March quarter, Hobart, Brisbane and Adelaide have continued to see strong growth.
Brisbane is the fastest-growing capital city market according to the report. Over the past 12 months house prices have risen 32.1%, adding over $200,000 to reach a new record high of $831,346.
Just north of Brisbane, the Sunshine Coast now has a median house price of over $1 million after 12 consecutive quarters of increases.
Adelaide house prices increased for the seventh consecutive quarter up 3% to a new record high of $750,084. This is the steepest house price upswing ever to be recorded for the city, at 28.1% over the past 12 months.
House prices in Hobart rose 4.3% over the quarter to a new record high of $758,141. This is the seventh consecutive quarter of growth and prices are 25.5% higher annually.
Advertisement
Buying a home or looking to refinance? The table below features home loans with some of the lowest interest rates on the market for owner occupiers.
| Lender | Home Loan | Interest Rate | Comparison Rate* | Monthly Repayment | Repayment type | Rate Type | Offset | Redraw | Ongoing Fees | Upfront Fees | Max LVR | Lump Sum Repayment | Extra Repayments | Split Loan Option | Tags | Features | Link | Compare | Promoted Product | Disclosure |
|---|---|---|---|---|---|---|---|---|---|---|---|---|---|---|---|---|---|---|---|---|
5.54% p.a. | 5.58% p.a. | $2,852 | Principal & Interest | Variable | $0 | $530 | 90% |
| Promoted | Disclosure | ||||||||||
5.49% p.a. | 5.40% p.a. | $2,836 | Principal & Interest | Variable | $0 | $0 | 80% |
| Promoted | Disclosure | ||||||||||
5.64% p.a. | 5.89% p.a. | $2,883 | Principal & Interest | Variable | $250 | $250 | 60% |
| Promoted | Disclosure | ||||||||||
5.64% p.a. | 5.89% p.a. | $2,883 | Principal & Interest | Variable | $248 | $350 | 60% |
| Disclosure |


")

Photo by saritjokro on Pixabay

Ready, Set, Buy!
Learn everything you need to know about buying property – from choosing the right property and home loan, to the purchasing process, tips to save money and more!
With bonus Q&A sheet and Crossword!


 Harry O'Sullivan
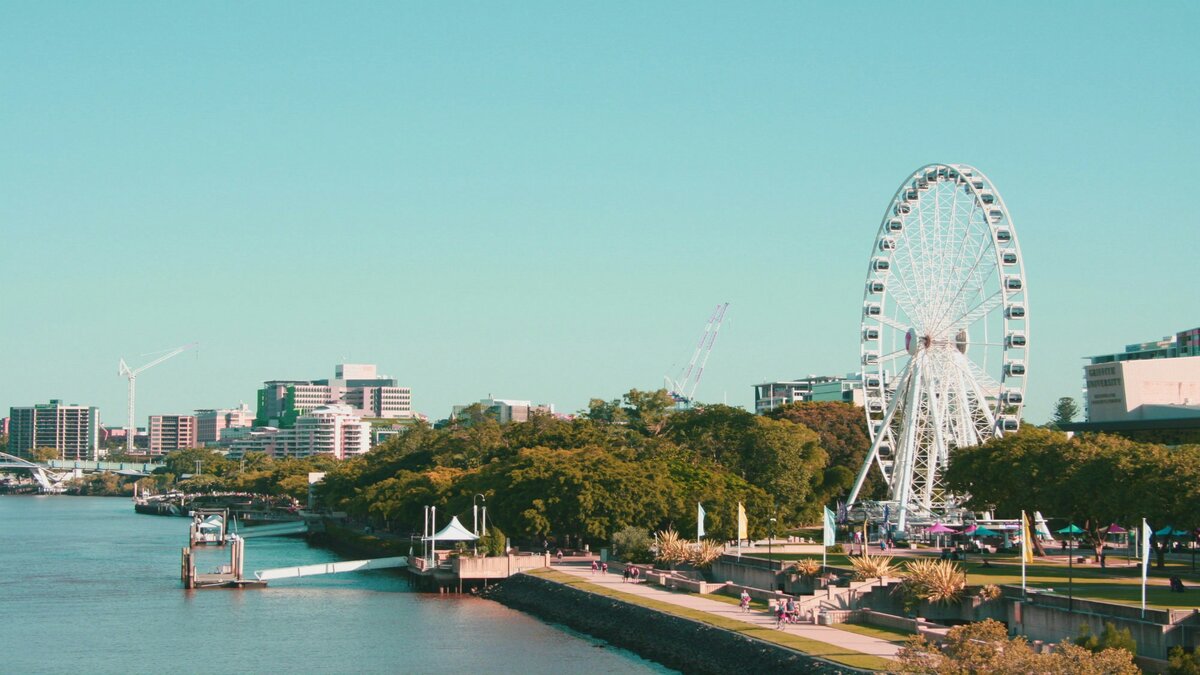
 Denise Raward
 William Jolly
 Arjun Paliwal