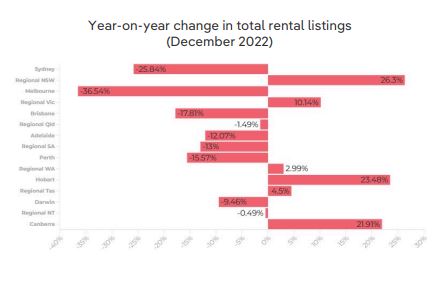
The Proptrack rental report for the final quarter of 2022 shows the combined total rental listings across Australia's capital cities is down 26.3% year on year, reaching the lowest total since February 2003.
Meanwhile, the number of enquires per rental listing in these cities rose 31.3% over the year, while regional areas saw a 30% decrease.
This shows a clear trend of Australians returning to the capital cities post-pandemic, with this excess demand one of the primary drivers of the rental crisis.
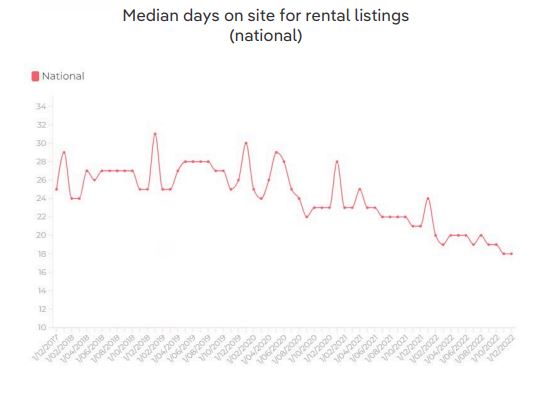
Data from realestate.com.au highlights the extent that demand for rental property is outstripping supply.
The average number of days a rental property was advertised on the site reached a record low in December 2022, with the median property spending just 18 days on the site before finding tenants.
Cameron Kusher, Director of Economic Research at Proptrack, expects tough rental conditions to continue.
"With low volumes of stock available for rent at a time when demand for rentals is strong and is likely to increase further, we expect the market to remain extremely challenging for renters," Mr Kusher said.
"With people now returning to capital cities and overseas migration lifting, it looks as if it will only become more difficult to rent
a property in the capitals during 2023."
The biggest cities saw the largest drops in rental supply, with a 36.5% decrease in Melbourne, 25.8% in Sydney and 17.8% in Brisbane.
Again, Mr Kusher believes this is a trend set to carry on into this year.
"In Sydney and Melbourne, the two largest rental markets in the country, rental stock is reducing quickly and demand for rental properties is increasing," he said.
"Most of the overseas migration that will occur over the coming years will be in these two cities, which will increase demand for rental accommodation."
Rental yields
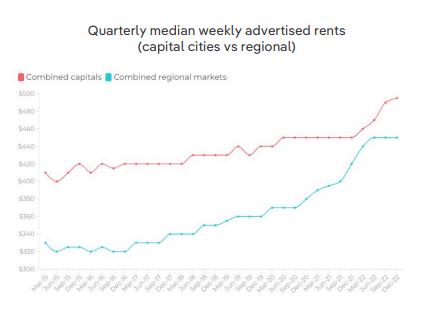
The pandemic saw a rise in rental rates, but this was outstripped by the increase in property value.
Rental yields therefore (as a proportion of property value) decreased.
However, with house prices expected to fall significantly this year, those with investment properties can expect better returns moving forward.
Median rental prices increased by 10% over the year, reaching a median price of $495 in the capital cities and a national average of $480.
No indication of shift from renting to buying
The PropTrack report though suggests there is little indication that renters are transitioning to homeowners.
Housing finance data from November 2022 showed $8.3 billion in lending to new investors, the lowest amount since April 2021.
For first home buyers, this was $3.9 billion, the lowest total since May 2020.
Relief in regional markets, Perth and Canberra
The report has a more positive outlook for those in Australia's regional areas.
New listings in regional markets were up 11.7% in December 2022 compared with December 2021.
Perth and Canberra also saw large increases in their rental supply.
While a surge in demand for capital cities presents challenges for the likes of Melbourne and Sydney, it also relieves demand in other parts of Australia.
In regional areas, the rental vacancy rate sat at 1.5% in December 2022, the highest since August 2022.
Mr Kusher predicted regional rental pressures to continue to ease in 2023.
"Regionally, some people that made the move during the pandemic are now planning to stay and shifting from renting into ownership and fewer people are migrating to the regions," he said.
"Based on these conditions, we expect that regional rental pressures are likely to continue to ease in 2023."
Is there a solution for the big cities?
With migration to our largest cities, both from inside and outside Australia, set to continue to rise after the pandemic, Mr Kusher does not see the excess demand for rental properties alleviating any time soon.
Instead, he advocates a supply side solution to the crisis.
"There remains an immense need for more rental accommodation, particularly in the major capital cities." Mr Kusher said.
"It’s critical that we find ways to create more supply – either through increased investment or more build-to-rent projects – or we reduce demand, which seems unlikely."
First published on January 2023
Picture by Jamie Davis on Unsplash

Ready, Set, Buy!
Learn everything you need to know about buying property – from choosing the right property and home loan, to the purchasing process, tips to save money and more!
With bonus Q&A sheet and Crossword!


 Harrison Astbury
 Harry O'Sullivan