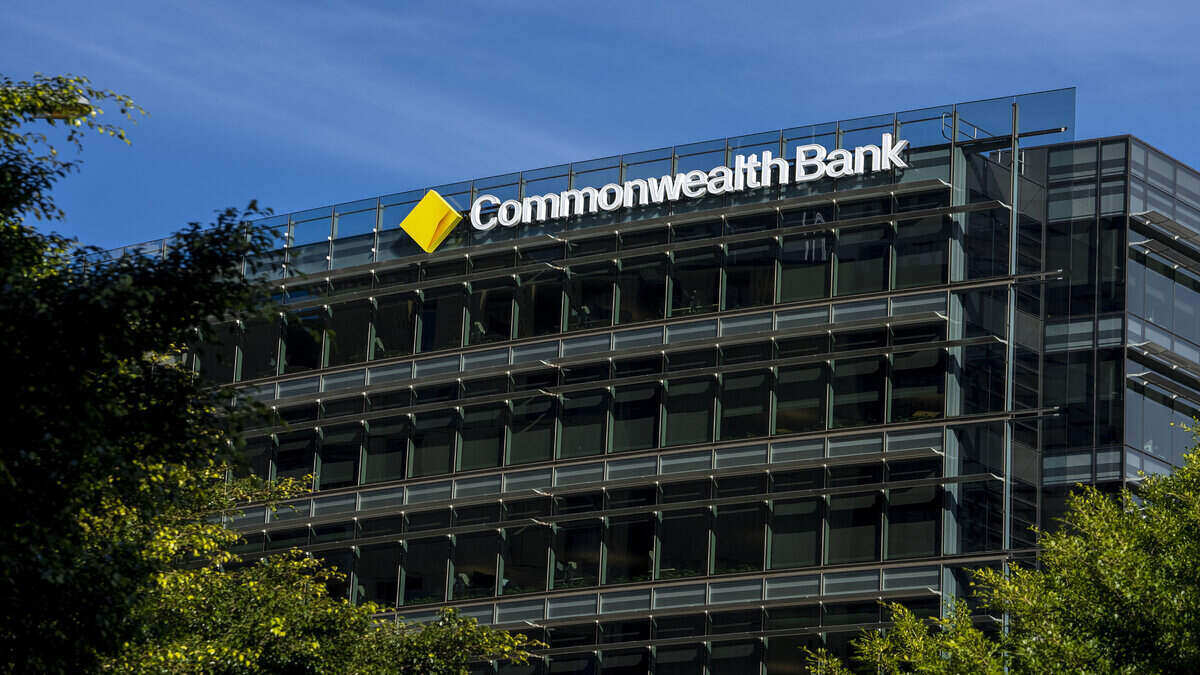
Developer contributions are used to fund local amenities, like schools and hospitals, usually State Government funded, and water and drainage for housing.
A report from the National Housing Finance and Investment Corporation (NHFIC), found "developer contributions for local infrastructure are inconsistent, lack transparency and have broadened in scope, adding more to the cost of new homes and potentially impeding new housing supply".
Case studies sourced by the NHFIC found developer contributions can add $25,000 to $85,000 to a new home in New South Wales.
They added $37,000 to $77,000 per dwelling in Victoria, and $29,000 to $42,000 per dwelling in Queensland.
The report noted developer contributions can typically amount to around 8-11% of total construction costs.
Of the Sydney Councils analysed by NHFIC, two-thirds and up to 88% of all funds raised by developer contributions between 2017 and 2020 were earmarked for social infrastructure, on average.
Around a third were earmarked for essential infrastructure, on average, typically leaning towards new housing developments.
NHFIC Chief Executive Nathan Dal Bon said the burden of funding local infrastructure had shifted from state governments and local council to new home buyers, potentially affecting housing supply.
"The expanding scope of developer contributions increasingly act like a tax on new housing, which can impede new housing supply and reduce housing affordability for buyers and renters," Mr Dal Bon said.
Contributions "act like a tax on new housing"
The report found "increasing expectations of good quality local amenity, rapid population growth and funding constraints such as municipal rate caps and an aversion to borrowing have left local governments struggling to keep up with the demand for public infrastructure and services".
Currently, there is no publicly available data on developer contributions, which the report said made it difficult to judge how they differ nationwide, impeding evaluation.
The Housing Industry of Australia (HIA) chief executive of industry policy, Kristin Brookfield, agreed contributions lacked transparency and were inconsistent.
"In almost all instances the development contribution models are complex to calculate and to administer. They introduce an element of uncertainty into the development process," Ms Brookfield said.
"The consequence being protracted decision making leading to unnecessary holding costs for landowners and residential developers.
"Ultimately these costs must be passed onto the home buyer and end up being carried through for the life of the mortgage."
Ms Brookfield said a conscious decision was made by the New South Wales Government to shift the majority of upfront costs onto new housing developments almost two decades ago.
"While Sydney is the most expensive, other states have taken the same approach and we are starting to see costs increase in most other states," she said.
"It’s also a concern that state governments are now using this mechanism to add costs to new housing for infrastructure that clearly serves more people than just new home buyers each year."
Advertisement
Buying a home or looking to refinance? The table below features home loans with some of the lowest interest rates on the market for owner occupiers.
| Lender | Home Loan | Interest Rate | Comparison Rate* | Monthly Repayment | Repayment type | Rate Type | Offset | Redraw | Ongoing Fees | Upfront Fees | Max LVR | Lump Sum Repayment | Extra Repayments | Split Loan Option | Tags | Features | Link | Compare | Promoted Product | Disclosure |
|---|---|---|---|---|---|---|---|---|---|---|---|---|---|---|---|---|---|---|---|---|
5.54% p.a. | 5.58% p.a. | $2,852 | Principal & Interest | Variable | $0 | $530 | 90% |
| Promoted | Disclosure | ||||||||||
5.49% p.a. | 5.40% p.a. | $2,836 | Principal & Interest | Variable | $0 | $0 | 80% |
| Promoted | Disclosure | ||||||||||
5.64% p.a. | 5.89% p.a. | $2,883 | Principal & Interest | Variable | $250 | $250 | 60% |
| Promoted | Disclosure | ||||||||||
5.64% p.a. | 5.89% p.a. | $2,883 | Principal & Interest | Variable | $248 | $350 | 60% |
| Disclosure |
Photo by Yogendra Singh on Unsplash

Ready, Set, Buy!
Learn everything you need to know about buying property – from choosing the right property and home loan, to the purchasing process, tips to save money and more!
With bonus Q&A sheet and Crossword!


 Bea Garcia
 Denise Raward
 Harry O'Sullivan
 Rachel Horan


