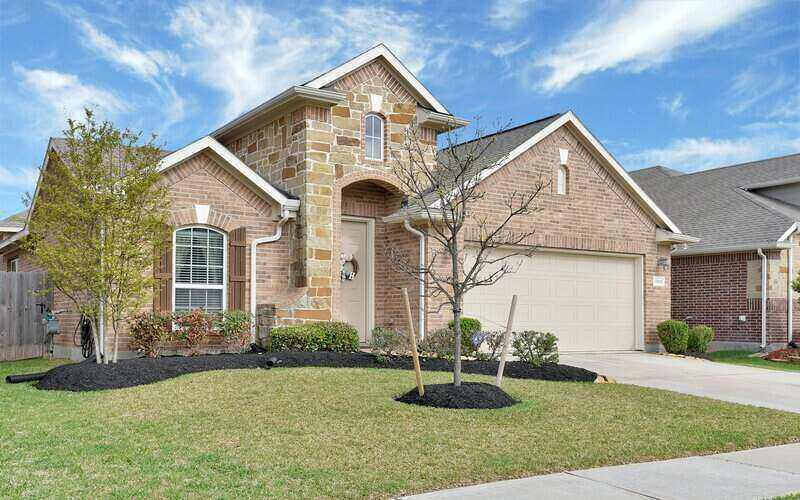
While interest rates continue to be high and cost of living pressures keep biting, older Australians living in large houses they no longer need could benefit hugely from selling their property and moving somewhere more affordable.
The Downsizing Index, from startup Downsizer.com, shows the top spots where residents of each of Australia's capitals are downsizing to.
Michael Blythe, former chief economist at CommBank, compiled the index, and believes downsizing is important for both the older Aussies involved and the broader housing market.
"Downsizers can free up equity and can boost their incomes, assisted by government incentives to place some of the funds into superannuation," Mr Blythe said.
"Downsizing also frees up housing stock for younger families."
The index is based on demographics, dwelling suitability, health indicators, financial indicators and mobility.
Mr Blythe said the index captured the differences in categories between the region and the capital city itself, to give an idea of the likelihood of downsizing activity.
A positive score on the index means the area scored higher than its respective capital city across the categories, while a negative one means it is below.
He believes it's information in which households, governments and developers should take note.
"This kind of data is valuable...to identify where the downsizing focus should be as we battle with the current nation-wide housing crisis and the longer-run pressures from the ageing population," he says.
Top downsizing spots from Sydney
|
Area |
Downsizer Index Score |
|
Outer West and Blue Mountains |
4.98 |
|
Sutherland Shire |
3.52 |
|
Northern Beaches |
2.95 |
|
Outer South-West |
2.28 |
|
Baulkham Hills and Hawkesbury |
1.74 |
Top downsizing spots from Melbourne
|
Geographical Area |
Downsizer Index Score |
|
Outer East |
4.44 |
|
Inner South |
3.65 |
|
Inner East |
1.41 |
|
North-West |
0.78 |
|
South-East |
0.73 |
Top downsizing spots from Brisbane
|
Geographical Area |
Downsizer Index Score |
|
Brisbane’s East |
7.2 |
|
Logan-Beaudesert |
2.66 |
|
Ipswich |
1.17 |
|
Brisbane’s North |
0.23 |
|
Moreton Bay-South |
0.16 |
Top downsizing spots from Adelaide
|
Geographical Area |
Downsizer Index Score |
|
South |
3.98 |
|
West |
0.65 |
|
North |
-1.51 |
|
Central and Hills |
-2.9 |
Top downsizing spots from Perth
|
Geographical Area |
Downsizer Index Score |
|
South-West |
11.1 |
|
Inner |
9.47 |
|
North-East |
8.65 |
|
North-West |
6.32 |
|
South-East |
4.81 |
Top downsizing spots from Tasmania
|
Geographical Area |
Downsizer Index Score |
|
South-Eastern Tasmania |
9.42 |
|
West and North-Western Tasmania |
6.04 |
|
Launceston and North-Eastern Tasmania |
1.6 |
|
Hobart |
-2.01 |
The suburbs where Aussies just won't let go
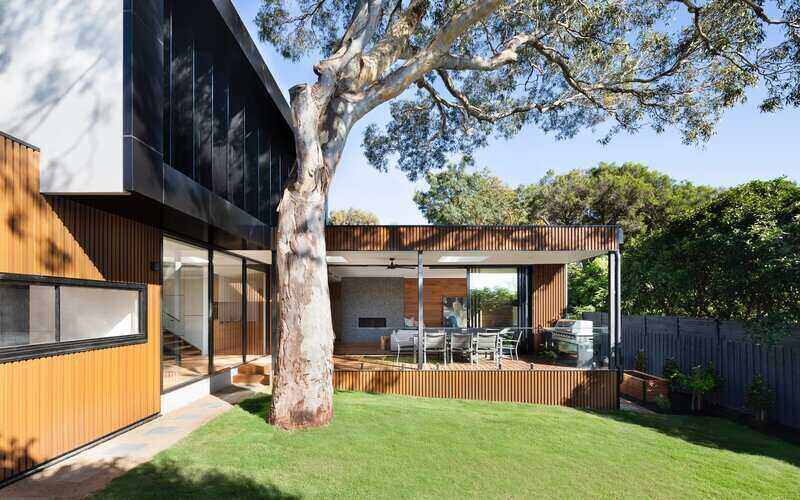
While the reasoning behind downsizing might be tough to argue with, it can be equally hard to move on from the home you've lived in for decades.
New data from PropTrack has revealed the Australian suburbs that seem to be grabbing residents' hearts the most, where the average homeowner holds on to their property the longest.
The list for houses consists exclusively of suburbs in Greater Sydney and Melbourne, and tended to be more prestige areas with only two of the ten having a median price under $1 million (based on recent sales data).
Units tend to be more prominent in regional areas.
Ten suburbs with the longest hold time (Houses)
|
Suburb |
Region |
Average hold period 2023 (years) |
REA median price (August 2022 - July 2023) |
|
Clarinda VIC 3169 |
Greater Melbourne |
24.40 |
$921,000 |
|
Vermont South VIC 3133 |
Greater Melbourne |
22.25 |
$1,425,000 |
|
Arncliffe NSW 2205 |
Greater Sydney |
21.20 |
$1,559,750 |
|
Monterey NSW 2217 |
Greater Sydney |
20.46 |
$2,330,000 |
|
Springvale South VIC 3172 |
Greater Melbourne |
20.43 |
$810,500 |
|
Allambie Heights NSW 2100 |
Greater Sydney |
20.16 |
$2,300,000 |
|
Watsonia North VIC 3087 |
Greater Melbourne |
20.12 |
$866,000 |
|
Collaroy NSW 2097 |
Greater Sydney |
19.82 |
$3,512,500 |
|
St Johns Park NSW 2176 |
Greater Sydney |
19.73 |
$1,100,000 |
|
Mont Albert VIC 3127 |
Greater Melbourne |
19.61 |
$2,384,000 |
Ten suburbs with the longest hold time (Units)
|
Suburb |
Region |
Average hold period 2023 (years) |
REA median price (August 2022 - July 2023) |
|
Carlton North VIC 3054 |
Greater Melbourne |
20.68 |
$685,000 |
|
Cremorne Point NSW 2090 |
Greater Sydney |
17.20 |
$1,450,000 |
|
Kirribilli NSW 2061 |
Greater Sydney |
16.14 |
$1,150,000 |
|
Narwee NSW 2209 |
Greater Sydney |
15.88 |
$575,000 |
|
Eastlakes NSW 2018 |
Greater Sydney |
15.86 |
$613,500 |
|
Minyama QLD 4575 |
Rest of Qld |
15.71 |
$575,000 |
|
Shelley WA 6148 |
Greater Perth |
15.68 |
$479,000 |
|
Canley Vale NSW 2166 |
Greater Sydney |
15.40 |
$405,000 |
|
Kalamunda WA 6076 |
Greater Perth |
15.37 |
$502,500 |
|
Monterey NSW 2217 |
Greater Sydney |
15.17 |
$680,000 |
Picture by Nicholas Gonzalez on Unsplash

Ready, Set, Buy!
Learn everything you need to know about buying property – from choosing the right property and home loan, to the purchasing process, tips to save money and more!
With bonus Q&A sheet and Crossword!


 Harry O'Sullivan

 Denise Raward
 Alex Brewster
 Rachel Horan