The Federal Chamber of Automotive Industries' (FCAI) 'VFACTS' report released today revealed the 93,555 new vehicle sales represents an increase of 10,243 vehicle sales compared to September 2021.
Car sales figures for the months prior in July and August reached 84,461 and 95,256 respectively, bringing the year-to-date total to 811,130.
Of that figure, 7,247 were fully-electric vehicles - more than hybrid and plug-in hybrids combined at 5,141.
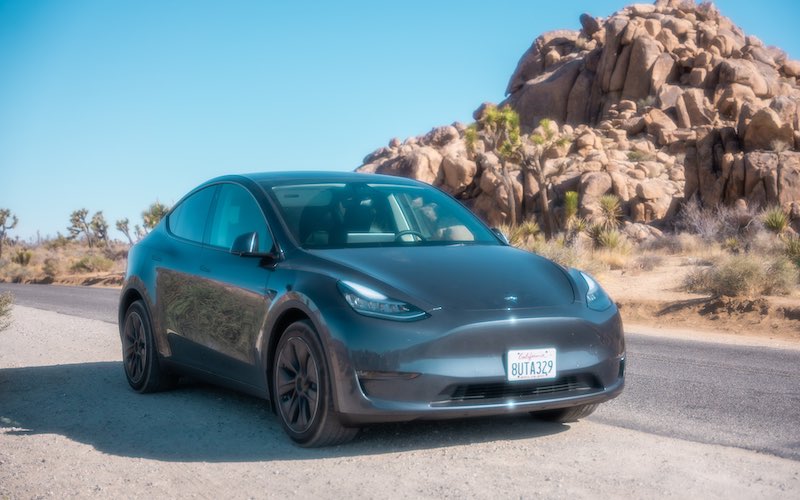
This was largely due to 4,359 Tesla Model Y units arriving on Aussie shores having already been sold on pre-order, making it the third-best selling vehicle.
This comes as the fuel excise discount was removed, which is set to push peak fuel prices over $2 per litre once again.
Other electric vehicle sales results for September 2022 include 140 sales for the Hyundai Ioniq 5; Polestar 2, 85; and Kia EV6, 60.
Top 10 Selling Vehicles
- Toyota Hilux - 5,170 units
- Ford Ranger - 4,890
- Tesla Model Y - 4,359
- Mazda CX-5 - 2,439
- Mitsubishi Triton - 2,319
- Isuzu D-Max Ute - 1,924
- Toyota RAV4 - 1,856
- Kia Sportage - 1,775
- Hyundai i30 - 1,733
The i30 was the only non-SUV or ute to feature in the top 10; Australia's cheapest fully-electric SUV the MG ZS also dropped out of the top 10.
See Also: Top Five Affordable Electric Cars in Australia
In the year-to-date, 21,771 electric vehicles have been sold, according to the FCAI chief Tony Weber.
“While the overall market share of battery electric vehicles remains low [2.7%], there is a clear market trend towards zero emission technology," Mr Weber said.
The VFACTS report revealed state-by-state sales statistics compared to September 2021, noting:
- Australian Capital Territory sales increased by 67.7% with 1,498 vehicles sold.
- New South Wales sales increased by 20.8% with 28,945 vehicles sold.
- Northern Territory sales decreased 9.8% with 832 vehicles sold.
- Queensland sales increased by 2.9% with 20,643 vehicles sold.
- Victoria sales increased by 23.8% with 25,367 vehicles sold.
- South Australia sales decreased 2.2% with 6,005 vehicles sold.
- Tasmania sales decreased 0.9% with 1,630 vehicles sold.
- Western Australia sales decreased 6.0% with 8,644 vehicles sold.
Toyota led the market with a total of 14,852 vehicles sold followed by Kia 7,290; Mazda 7,259; and Mitsubishi, 6,784.
Savings to be had with EVs
A survey of 741 Tesla drivers conducted by the Electric Vehicle Council and the Tesla Owners Club of Australia (TOCA), found technology (83%) and environment (78%) were the most common reasons for buying a Tesla.
Almost half of the respondents said they save more than $2,000 on petrol a year, while 77% save more than $1,000.
“EV owners are saving thousands of dollars on fuel and maintenance costs,” said Behyad Jafari, Electric Vehicle Council Chief Executive.
“At a time when petrol and diesel prices are going through the roof, the Australian government must introduce long-overdue fuel efficiency standards to cut costs in the future and drive down emissions.”
Image by Tyler Casey on Unsplash

Ready, Set, Buy!
Learn everything you need to know about buying property – from choosing the right property and home loan, to the purchasing process, tips to save money and more!
With bonus Q&A sheet and Crossword!

