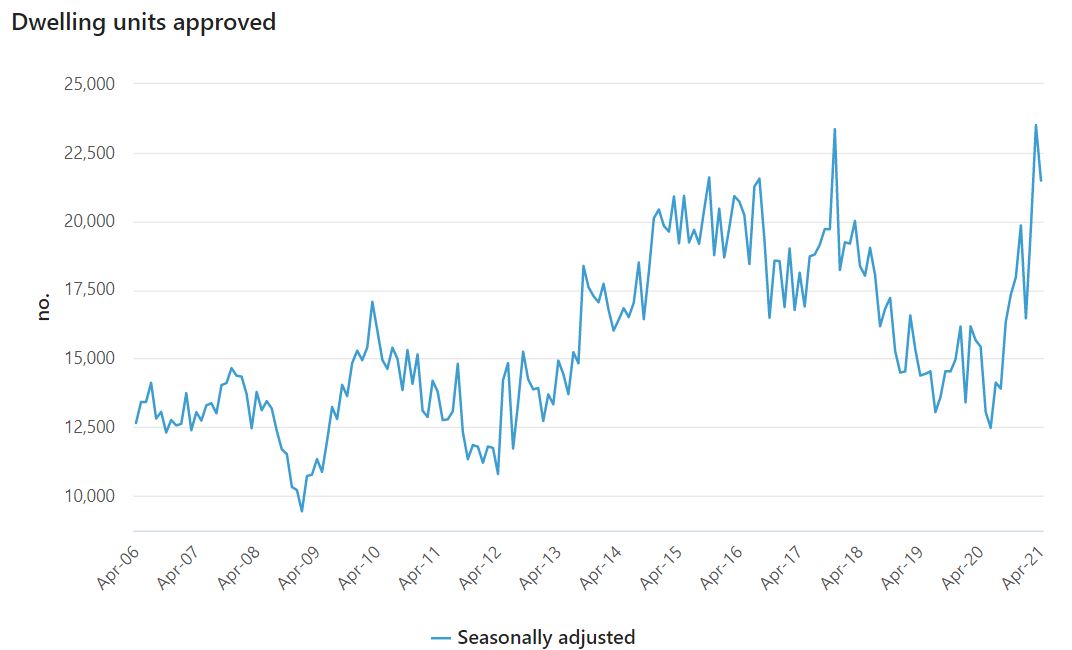
The figures from the Australian Bureau of Statistics (ABS) were better than expected, with economists forecasting a 10.0% drop.
The fall in the number of dwellings approved in April was driven by a 28.6% drop in private sector apartments and townhouses.
Looking to build a home? Below are a handful of low-rate construction loans in the market.
| Lender | Home Loan | Interest Rate | Comparison Rate* | Monthly Repayment | Repayment type | Rate Type | Offset | Redraw | Ongoing Fees | Upfront Fees | Max LVR | Lump Sum Repayment | Extra Repayments | Split Loan Option | Tags | Features | Link | Compare | Promoted Product | Disclosure |
|---|---|---|---|---|---|---|---|---|---|---|---|---|---|---|---|---|---|---|---|---|
5.93% p.a. | 6.19% p.a. | $2,471 | Interest-only | Variable | $0 | $530 | 90% |
| Promoted | Disclosure | ||||||||||
5.69% p.a. | 5.71% p.a. | $2,899 | Principal & Interest | Variable | $0 | $350 | 80% | |||||||||||||
5.94% p.a. | 6.00% p.a. | $2,475 | Interest-only | Variable | $0 | $835 | 90% | |||||||||||||
6.14% p.a. | 6.53% p.a. | $2,558 | Interest-only | Variable | $null | $721 | 90% | |||||||||||||
6.24% p.a. | 6.31% p.a. | $2,600 | Interest-only | Variable | $0 | $450 | 80% | |||||||||||||
6.44% p.a. | 6.41% p.a. | $2,683 | Interest-only | Variable | $0 | $530 | 90% | |||||||||||||
6.74% p.a. | 7.51% p.a. | $2,808 | Interest-only | Variable | $20 | $644 | 90% | |||||||||||||
7.89% p.a. | 8.22% p.a. | $3,631 | Principal & Interest | Variable | $0 | $0 | 75% | |||||||||||||
7.19% p.a. | 6.90% p.a. | $2,996 | Interest-only | Variable | $0 | $1,212 | 90% | |||||||||||||
8.18% p.a. | 8.25% p.a. | $3,732 | Principal & Interest | Variable | $0 | $900 | 80% | |||||||||||||
5.94% p.a. | 6.36% p.a. | $2,978 | Principal & Interest | Variable | $395 | $null | 95% | |||||||||||||
5.18% p.a. | 5.77% p.a. | $2,739 | Principal & Interest | Variable | $350 | $0 | 90% |
Daniel Rossi, director of construction statistics at the ABS, said despite the drop, the aftermath of HomeBuilder meant there was still serious demand for new builds.
"While there was a fall in overall approvals, the April result highlights the continued strong demand for detached housing, with private sector house approvals reaching a new record high in April, up 4.6%," Mr Rossi said.
"Since the introduction of HomeBuilder in June 2020, private house approvals have risen 84%, with South Australia hitting a new record high in April, and New South Wales reaching the highest level since December 1988."
HomeBuilder's expiry on April 14 didn't affect the April data from the ABS, as the building approval process typically occurs after the HomeBuilder application submission.
Source: ABS
ANZ economists said they expected to see growth continue, with total annual approvals at their second highest level since November 2017.
"We could see continuing growth in unit approvals as optimism about the labour market flows continues to flow through to investor lending," they said.
"In March, investor lending growth (54.3% y/y) converged with owner occupier lending growth (55.6% y/y) for the first time since the pandemic downturn.
"Very low interest rates (including strong forward guidance on interest rates by the RBA) and continued fiscal support for home buyers announced in the May budget are also supporting demand for housing, which is likely to keep supporting approvals past the effects of Homebuilder."
New South Wales was the strongest performer, where total dwelling approvals rose 12.3%, followed by Western Australia (5.5%), and South Australia (3.4%).
Victoria recorded a 25.3% fall, with Queensland the next worst performer (-14.3%).
The value of total building approved decreased 22.6%, in seasonally adjusted terms.
The value of total residential building fell 7.1%, driven by a 7.6% fall in new residential building and a 3.8% fall in residential alterations and additions.
The value of non-residential building fell 43.2%, mainly driven by a decrease in public sector approvals, following a record high reached in March.
Photo by Dakota Roos on Unsplash

Ready, Set, Buy!
Learn everything you need to know about buying property – from choosing the right property and home loan, to the purchasing process, tips to save money and more!
With bonus Q&A sheet and Crossword!




 Harry O'Sullivan

 Denise Raward
 Rachel Horan