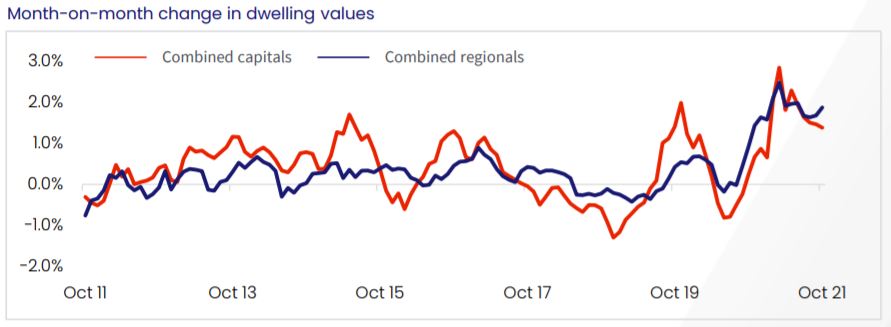
CoreLogic's Hedonic Home Value Index for October shows slowing growth conditions have been impacted by worsening housing affordability, rising supply levels and less stimulus.
According to the report, Sydney and Melbourne's monthly rate of growth has more than halved since the highs seen in March 2021, when they reached a monthly growth rate of 3.7% and 2.4% respectively.
Brisbane has taken over as the fastest growing market with housing values up 2.5% in October. This was followed by Adelaide and Hobart, with both dwelling markets increasing 2.0% in value over the month.
Perth recorded its first negative monthly result since June last year, with values nudging -0.1% lower.
Change in Dwelling Values as at 31 October, 2021
| Month | Quarter | Annual | Total return | Median Value | |
| Sydney | 1.50% | 5.24% | 25.23% | 28.22% | $1,071,709 |
| Melbourne | 0.99% | 3.01% | 16.37% | 19.22% | $780,303 |
| Brisbane | 2.54% | 6.50% | 22.30% | 27.07% | $642,097 |
| Adelaide | 2.00% | 5.86% | 20.07% | 25.08% | $543,265 |
| Perth | -0.11% | 0.65% | 16.37% | 21.42% | $526,625 |
| Hobart | 2.00% | 6.66% | 28.06% | 33.75% | $678,170 |
| Darwin | 0.42% | 0.41% | 19.28% | 26.15% | $490,236 |
| Canberra | 1.94% | 6.18% | 25.52% | 30.12% | $864,909 |
| Combined Capitals | 1.38% | 4.41% | 20.82% | 24.24% | $771,264 |
| Combined Regionals | 1.87% | 5.28% | 24.29% | 29.67% | $514,308 |
| National | 1.49% | 4.60% | 21.58% | 25.35% | $686,339 |
Source: CoreLogic
CoreLogic’s research director, Tim Lawless, said first home buyers are becoming a smaller portion of the housing market.
"Housing prices continue to outpace wages by a ratio of about twelve-to-one," Mr Lawless said.
"This is one of the reasons why first home buyers are becoming a progressively smaller component of housing demand.
"New listings have surged by 47% since the recent low in September and housing focused stimulus such as HomeBuilder and stamp duty concessions have now expired.
"Combining these factors with the subtle tightening of credit assessments set for November 1, and it’s highly likely the housing market will continue to gradually lose momentum."
Although the monthly pace of growth is easing, the annual trend has continued to rise, which is a factor of the stronger growth conditions throughout early 2021.
Nationally home values are up 21.6% over the year to October, with half the capitals recording an annual growth rate in excess of 20%.
Across the broad regions of Australia, regional Tasmania has led the nation for the pace of annual capital gains with dwelling values rising by 29.1%.
Supply matching demand
CoreLogic data shows the rise in new listings has outweighed buyer demand, pushing the total number of houses and units available for sale to 141,786 - a 6.8% increase in active listings from the recent mid-September low.
CoreLogic counted 47,040 newly advertised properties entering the market over the four weeks ending 24 October.
This represents a 22.7% rise on last year and 5.2% above the five-year average. New listings are up 47.0% from their recent low over the four weeks ending 5 September.
Persistently low levels of housing inventory have been a central factor in the upwards pressure on housing prices.
"More listings mean more choice for buyers and less urgency in their purchasing decisions. FOMO is likely to remain a feature of
the market while listings remain so far below average," Mr Lawless said.
"There is a good chance however, that advertised supply will rise further through spring and early summer which, due to worsening housing affordability and a subtle tightening in credit availability, may not be met by a commensurate lift in demand."
What's next for the housing market?
Mr Lawless illustrated where Australian housing markets could head.
"As housing becomes less affordable, we expect to see more demand deflected towards the higher density sectors of the market, especially in Sydney where the gap between the median house and unit value is now close to $500,000," he said.
"With investors becoming a larger component of new housing finance, we may see more demand flowing into medium
to high density properties.
"Investor demand across the unit sector could be bolstered as overseas borders open, which is likely to have a positive impact on rental demand, especially across inner city unit precincts."
Source: CoreLogic
Advertisement
Buying a home or looking to refinance? The table below features home loans with some of the lowest interest rates on the market for owner occupiers.
| Lender | Home Loan | Interest Rate | Comparison Rate* | Monthly Repayment | Repayment type | Rate Type | Offset | Redraw | Ongoing Fees | Upfront Fees | Max LVR | Lump Sum Repayment | Extra Repayments | Split Loan Option | Tags | Features | Link | Compare | Promoted Product | Disclosure |
|---|---|---|---|---|---|---|---|---|---|---|---|---|---|---|---|---|---|---|---|---|
5.54% p.a. | 5.58% p.a. | $2,852 | Principal & Interest | Variable | $0 | $530 | 90% |
| Promoted | Disclosure | ||||||||||
5.49% p.a. | 5.40% p.a. | $2,836 | Principal & Interest | Variable | $0 | $0 | 80% |
| Promoted | Disclosure | ||||||||||
5.64% p.a. | 5.89% p.a. | $2,883 | Principal & Interest | Variable | $250 | $250 | 60% |
| Promoted | Disclosure | ||||||||||
5.64% p.a. | 5.89% p.a. | $2,883 | Principal & Interest | Variable | $248 | $350 | 60% |
| Disclosure |


")

Image by Kleber Varejao via Unsplash

Ready, Set, Buy!
Learn everything you need to know about buying property – from choosing the right property and home loan, to the purchasing process, tips to save money and more!
With bonus Q&A sheet and Crossword!


 Denise Raward
 Harry O'Sullivan

 Arjun Paliwal