According to Domain's September House Price Report, Sydney, Melbourne and Canberra now all have a median house price surpassing $1 million.
Brisbane, Adelaide and Hobart have now hit record highs, too.
Highlights:
- House prices rose by roughly $6,700 a week over the past year in Sydney.
- Canberra is now the second most expensive capital city to purchase a house - the first time in 16 years.
- Perth is currently the most affordable city to purchase a house.
- Hobart house prices have almost doubled over the past five years
September House Price Report
| City | Sep-21 | June-21 | Sep-20 | Quarterly Change | Annual Change |
| Sydney | $1,499,126 | $1,432,901 | $1,149,828 | +4.6% | +30.4% |
| Melbourne | $1,037,923 | $1,021,790 | $888,755 | +1.6% | +16.8% |
| Brisbane | $702,455 | $673,176 | $609,304 | +4.3% | +15.3% |
| Adelaide | $667,888 | $632,337 | $555,920 | +5.6% | +20.1% |
| Canberra | $1,074,187 | $1,015,833 | $811,421 | +5.7% | +32.4% |
| Perth | $598,601 | $602,248 | $545,129 | -0.6% | +9.8% |
| Hobart | $698,212 | $631,630 | $529,190 | +10.5% | +31.9% |
| Darwin | $640,068 | $608,760 | $480,620 | +5.1% | +33.2% |
| National | $994,579 | $961,182 | $816,082 | +3.5% | +21.9% |
Source: Domain
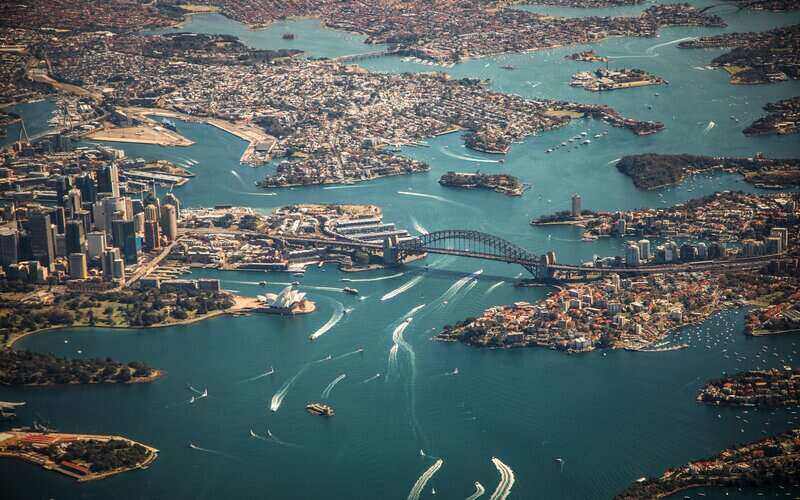
Sydney
According to Domain's report, house prices rose by roughly $6,700 a week over the past year, a total rise of just over $349,000, to a new record of almost $1.5 million.
This is the fastest annual rate of growth on record, at 30.4%.
While house prices continued to rise over the September quarter, the pace of growth has halved from the March quarter to 4.6%, meaning the rapid rate of growth may be slowing down.
"The sheer affordability of keeping up with rapid house price gains is proving a barrier for buyers, especially first home buyers facing spiralling deposit goals and poor interest accrued on savings," the report read.
"This has resulted in the number of home loans for NSW owner-occupier first home buyers dropping 21% from the recent March high."
Also read: First home buyers missing out on the housing boom.
Melbourne
Melbourne house prices hit another new record of $1.038 million after rising 16.8% over the past year. This is the strongest annual gain in 11 years.
While house prices rose 1.6% over the September quarter, the pace of growth has more than halved compared to the previous quarter.
"While lockdown impacted the September quarter and house price growth more than halved, it is still the highest annual increase in 11 years," Domain's report said.
"Lengthy lockdowns continued to drive buyer preference to larger homes and more space.
"This has resulted in house prices growing almost three times faster than units over the past year, a divergence that has created a record price gap."
Also read:
- Melbourne now cheapest capital in Australian to rent a house
- Why are house prices outpacing unit prices?
Brisbane
House prices reached a new record high at $702,455, after a $29,279 increase in the September quarter, rising three times faster than the corresponding quarter last year.
Domain listed Brisbane as the main benefactor of lockdowns in southern states, as many flocked north to escape restrictions.
In dollar terms, the $255 daily increase in house prices over the past 12 months is the largest on record.
However quarterly house price gains have started to lose momentum, one-third lower than the previous quarter.
While the pace of growth has eased, Brisbane is poised for further growth as demand continues to run ahead of supply.
Also read: How Brisbane became Australia's new property darling
Adelaide
House prices jumped 5.6% over the September quarter to a new record high of $667,888. Annual growth is now at the strongest rate since 2008 at 20.1%.
The $307 daily increase in house prices over the past 12 months is the largest on record.
Quarterly house price growth has outstripped units since late 2020, providing the biggest median price gap between the property types on record.
Canberra
House prices jumped 5.7% over the quarter to reach a new record high of $1.074 million.
This makes the past year the strongest upswing in Canberra's house price history, up 32.4%, a record $720 increase per day.
Since the pandemic, Canberra house prices have risen 38.4%, the highest rate of growth across the cities.
For the first time since 2005, Canberra is now the second most expensive capital city to purchase a house.
Perth
For the first time in two years, house prices declined marginally over the September quarter by 0.6%.
Perth was the only capital city to record a decline over the quarter for both houses and units, down 3.3%.
Despite this, house prices remain only $17,316 below the late-2014 record high at $598,601 following a 9.8% annual increase.
Perth is currently the most affordable city to purchase a house as prices rapidly rise across the other cities.
Hobart
House prices new record edges close to $700,000, after jumping almost $67,000 over the September quarter. Annually, they are 31.9% higher, the strongest increase in 17 years.
Hobart house prices have almost doubled over the past five years, the steepest increase of the capital cities.
"Record-breaking house prices reached a whole new level over September’s quarter after the median edges close to $700,000 for the first time," the report read.
"At the end of 2019 Hobart was the most affordable capital city to purchase a house, in this short time they have overtaken Darwin, Perth, Adelaide and are almost more expensive than Brisbane (just over $4,000 separates the two cities)."
Darwin
House prices have now reached the highest point in almost six years. Now at $640,068, it’s seen the strongest annual growth since 2004, at 33.2%. While the pace of annual growth is rising, quarterly growth has eased to 5.1%.
Houses remain just over $38,000 lower than the late-2013 high - but it would only take two more quarters at the same growth to surpass this peak.
Despite the record increases across the quarter, the big banks have indicated tightening policies will offer some reprieve in the next two years.
Westpac have predicted property to rise a further 8% in 2022, with NAB predicting a more modest 5% rise in 2022.
Advertisement
Buying a home or looking to refinance? The table below features home loans with some of the lowest interest rates on the market for owner occupiers.
| Lender | Home Loan | Interest Rate | Comparison Rate* | Monthly Repayment | Repayment type | Rate Type | Offset | Redraw | Ongoing Fees | Upfront Fees | Max LVR | Lump Sum Repayment | Extra Repayments | Split Loan Option | Tags | Features | Link | Compare | Promoted Product | Disclosure |
|---|---|---|---|---|---|---|---|---|---|---|---|---|---|---|---|---|---|---|---|---|
5.54% p.a. | 5.58% p.a. | $2,852 | Principal & Interest | Variable | $0 | $530 | 90% |
| Promoted | Disclosure | ||||||||||
5.49% p.a. | 5.40% p.a. | $2,836 | Principal & Interest | Variable | $0 | $0 | 80% |
| Promoted | Disclosure | ||||||||||
5.64% p.a. | 5.89% p.a. | $2,883 | Principal & Interest | Variable | $250 | $250 | 60% |
| Promoted | Disclosure | ||||||||||
5.64% p.a. | 5.89% p.a. | $2,883 | Principal & Interest | Variable | $248 | $350 | 60% |
| Disclosure |


")

Image by Jamie Davies via Unsplash

Ready, Set, Buy!
Learn everything you need to know about buying property – from choosing the right property and home loan, to the purchasing process, tips to save money and more!
With bonus Q&A sheet and Crossword!


 Harry O'Sullivan
 Bea Garcia
 Denise Raward
 Rachel Horan
 Brooke Cooper