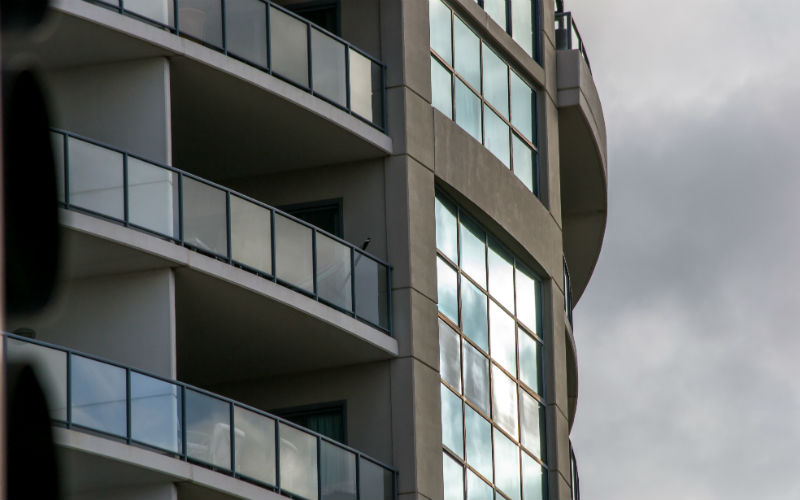
CoreLogic’s Home Value Index Report revealed national dwelling values fell 1.3% in July alone.
This marked the third consecutive decline for national housing values.
The latest data shows the median property value (includes houses and apartments) has dropped 2% since the beginning of May to $747,182.
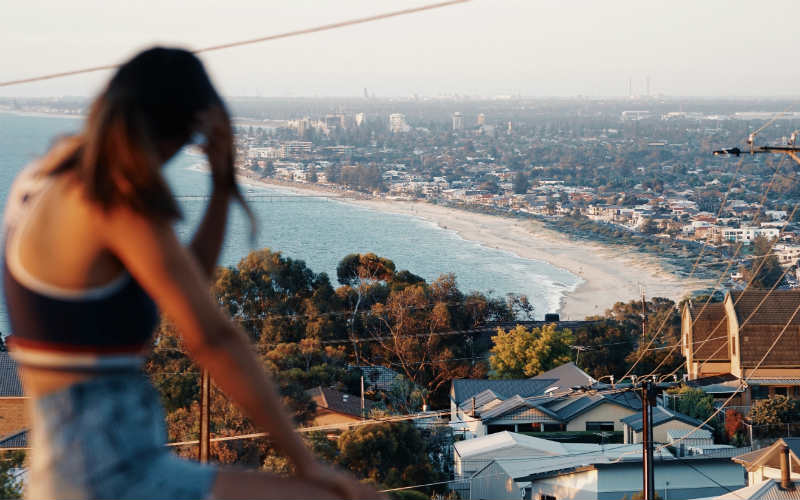
Five out of the eight capital cities recorded a month-on-month decline with Sydney down 2.2% followed by Melbourne with 1.5%.
Brisbane also creeped into negative growth territory for the first time since August 2020 with values down 0.8%.
Hobart and Canberra were also down for the month with -1.5% and -1.1% respectively.
| Month | Quarter | Annual | Total return | Median value | |
| Sydney | -2.2% | -4.7% | 1.6% | 3.4% | $1,087,376 |
| Melbourne | -1.5% | -3.2% | 0.3% | 3.2% | $791,999 |
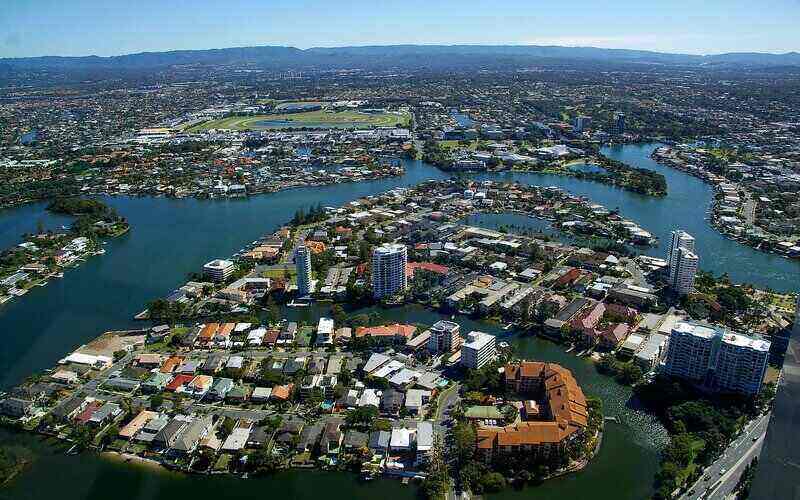
| Brisbane | -0.8% | 0.1% | 22.1% | 26.4% | $781,850 |
| Adelaide | 0.4% | 3.6% | 24.1% | 28.3% | $650,047 |
| Perth | 0.2% | 1.2% | 5.5% | 10.0% | $560,020 |
| Hobart | -1.5% | -1.3% | 10.1% | 14.1% | $723,066 |
| Darwin | 0.5% | 1.9% | 5.3% | 11.9% | $506,860 |
| Canberra | -1.1% | -0.9% | 12.1% | 16.5% | $925,973 |
| Combined capitals | -1.4% | -2.6% | 5.4% | 8.0% | $819,880 |
| Combined regional | -0.8% | -0.2% | 17.0% | 21.1% | $600,105 |
| National | -1.3% | -2.0% | 8.0% | 10.8% | $747,812 |
Source: CoreLogic
“Although the housing market is only three months into a decline, the national Home Value Index shows that the rate of decline is comparable with the onset of the global financial crisis (GFC) in 2008, and the sharp downswing of the early 1980s,” said Tim Lawless, CoreLogic research director.
“In Sydney, where the downturn has been particularly accelerated, we are seeing the sharpest value falls in almost 40 years,” he said.
AMP chief economist Shane Oliver suggested the property boom is well and truly over due to a number of contributing factors.
“The key drivers of the downtown are: poor affordability, rising mortgage rates, a rise in new listings in Sydney and Melbourne, cost of living pressures making it harder to save for a deposit, and a collapse in consumer and homebuyer confidence,” Mr Oliver said.
“But the main driver of the slowdown so far is the surge in mortgage rates - being able to borrow at a fixed rate of 2% or less was a key driver of the boom in prices.
“But with fixed mortgage rates now up nearly three-fold from their lows and variable rates rising rapidly, this has substantially reduced the amount new homebuyers can borrow and hence their capacity to pay.”
On the opposite end of the spectrum, Darwin, Adelaide, and Perth recorded positive growth in July with +0.5%, +0.4%, and +0.2% respectively. However, these rates have been declining since the first interest rate hike in May.
Regional markets record their first monthly decline since 2020
The combined regionals index recorded its first monthly decline since August 2020 with -0.8%.
While regional NSW (-1.1%), regional VIC (-0.7%), regional QLD (-0.7%), and regional TAS (-0.6%) recorded decreases, values continued on an upward trend in regional SA and regional WA with 1.1% and 0.1% respectively.
The areas that saw a decline in home values over the three months to July include Geelong, Ballarat, Illawarra, Newcastle and Lake Macquarie, the Southern Highlands and Shoalhaven, the Gold Coast and the Sunshine Coast.
Although regional areas are outperforming capital cities, Mr Lawless pointed out that “major regional centres are not immune to falling home values.”
Housing market conditions likely to worsen amid interest rate hikes
“As borrowing power is eroded by higher interest rates, and rising household expenses due to inflation, it’s reasonable to expect a further loss of momentum in housing demand,” Mr Lawless said.
Mr Oliver also follows this sentiment as he expects national average property prices to fall further over the next 12 to 18 months.
“Assuming the cash rate tops to around 2.6% early next year as we expect then average prices are likely to fall 15-20% from top to bottom with the low likely being reached in the second half of next year,” he said.
“Sydney, Melbourne and Canberra are likely to see 20% or so falls.
“Brisbane, Adelaide and Hobart are likely to see 15% or so declines and falls are likely to be only around 5-10% in Perth and Darwin.”
Advertisement
Buying a home or looking to refinance? The table below features home loans with some of the lowest interest rates on the market for owner occupiers.
| Lender | Home Loan | Interest Rate | Comparison Rate* | Monthly Repayment | Repayment type | Rate Type | Offset | Redraw | Ongoing Fees | Upfront Fees | Max LVR | Lump Sum Repayment | Extra Repayments | Split Loan Option | Tags | Features | Link | Compare | Promoted Product | Disclosure |
|---|---|---|---|---|---|---|---|---|---|---|---|---|---|---|---|---|---|---|---|---|
5.54% p.a. | 5.58% p.a. | $2,852 | Principal & Interest | Variable | $0 | $530 | 90% |
| Promoted | Disclosure | ||||||||||
5.49% p.a. | 5.40% p.a. | $2,836 | Principal & Interest | Variable | $0 | $0 | 80% |
| Promoted | Disclosure | ||||||||||
5.64% p.a. | 5.89% p.a. | $2,883 | Principal & Interest | Variable | $250 | $250 | 60% |
| Promoted | Disclosure | ||||||||||
5.64% p.a. | 5.89% p.a. | $2,883 | Principal & Interest | Variable | $248 | $350 | 60% |
| Disclosure |


")

Image by sandid via Pixabay

Ready, Set, Buy!
Learn everything you need to know about buying property – from choosing the right property and home loan, to the purchasing process, tips to save money and more!
With bonus Q&A sheet and Crossword!


 Harrison Astbury
 Denise Raward