PRD's latest Major City Market Updates revealed clear trends emerging among some of Australia's capital cities: Brisbane, Sydney, Melbourne, and Hobart.
The report's divided each capital city into 'rings' - inner, middle, and outer - which allowed for a comprehensive and in-depth analysis of each market.
Both house and unit property types were covered in the report, with information including sales volumes median prices, median price growth, rental market performance, vacancy rates, and much more.
Chief Economist at PRD Dr Diaswati Mardiasmo said that the aforementioned capital city markets are still generally on a growth trajectory, recording prices and growth trends 'never seen before'.
"The trend of purchasing close to or above the first list asking price is still evident, and average days on market is low – all of which points to a strong demand," Dr Mardiasmo told Savings.com.au.
"The rental market continues to be undersupplied, with increasing rent evident in most markets, and a vacancy rate that have trended at a historical low for the past 12 to 18 months."
She said there are nuances within each capital city, and in the inner, middle and outer rings.
"Because of this, it is key for buyers and investors to separate the market accordingly and have a full set of data prior to making decisions," Dr Mardiasmo said.
"More often than not a buyer or investor has a certain budget, thus the question becomes: which 'ring' will serve their interests the best?"
With this in mind, let's discuss the key findings from PRD's reports for each capital city.
Brisbane
Brisbane's property market saw 'exponential' growth, particularly in the middle ring suburbs, with the median house price currently sitting at $910,000 - 36.8% up from 2017.
According to PRD, there is now a 'distinctively' different housing market between Brisbane's inner and outer rings.
Many (64.2%) inner city suburbs come with 'premium' prices of $1.1 million and above, whereas suburbs in the outer ring are the 'most affordable' prices of less than $800,000.
House rental prices have increased, again particularly in the middle ring, while unit rents have risen the most in the outer ring.
Middle ring rents for a one-bedroom unit saw the biggest annual increase in median rent prices, up by 10.3%.
Additionally, vacancy rates in Brisbane have hit a record low of 1.1%, which is a drop of one percentage point annually.
Sydney
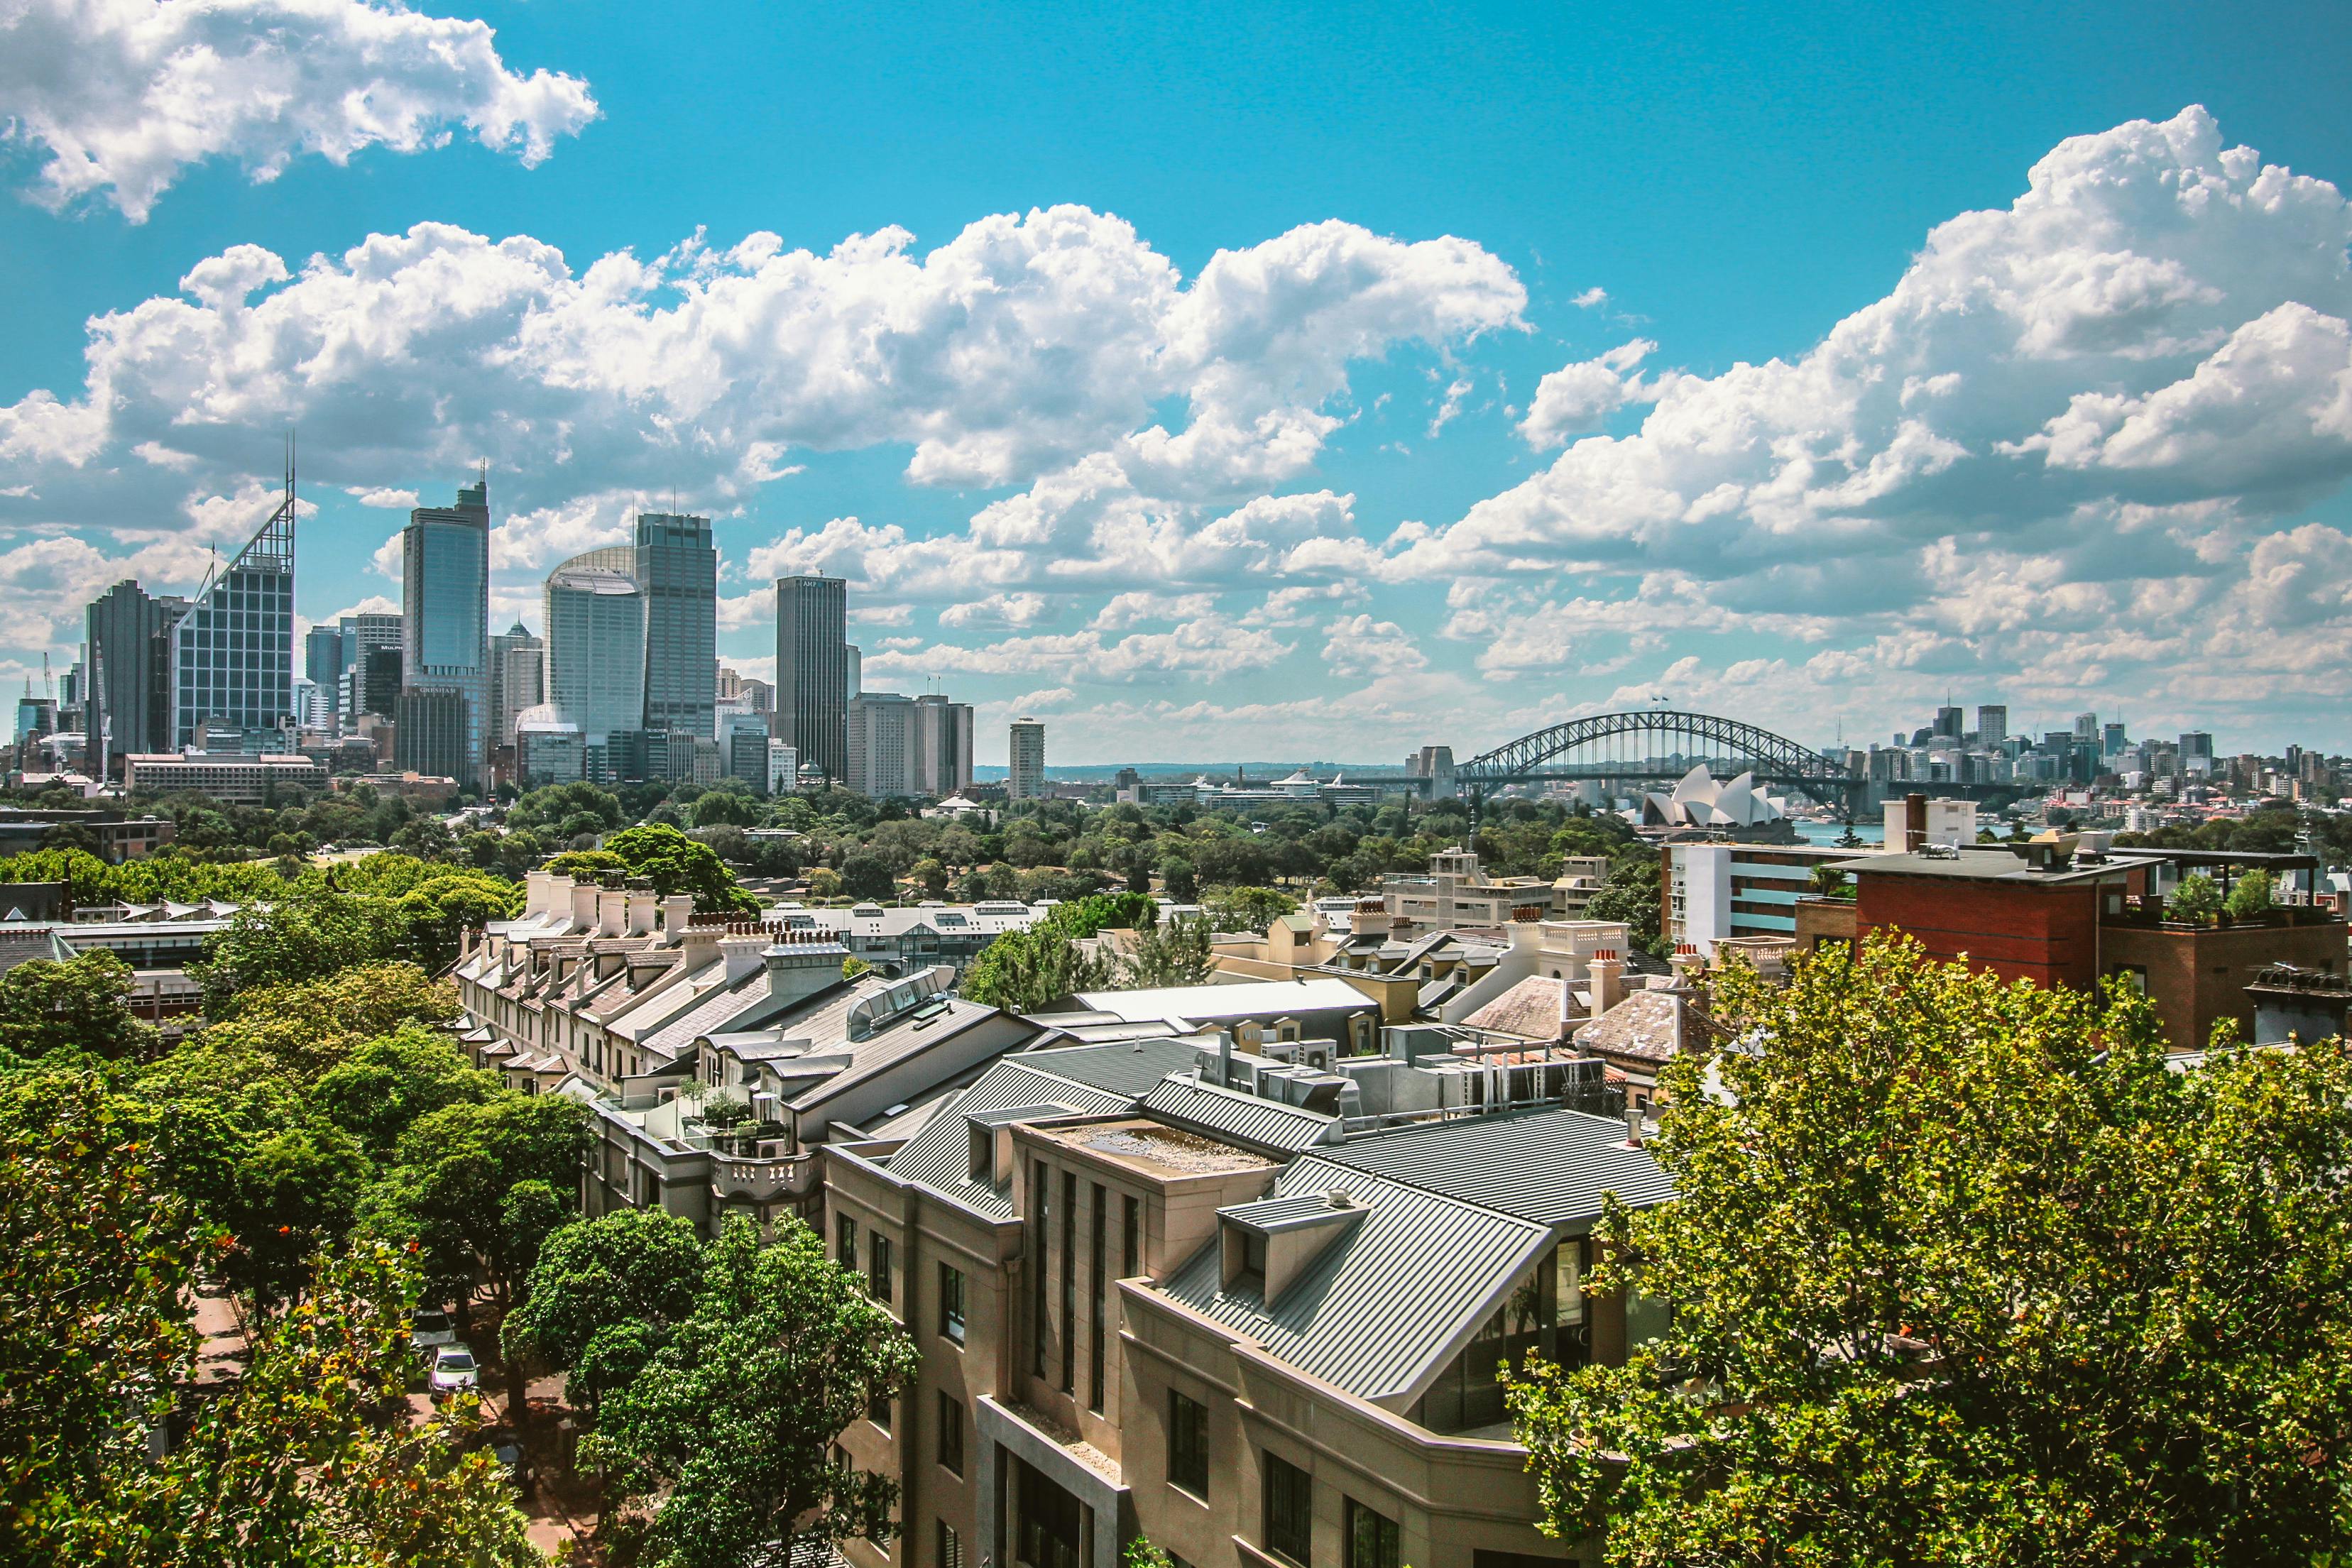
Across all three rings, Sydney house prices have seen 'strong' growth, with the inner and middle rings both sitting above $2.5 million.
House buyers with a budget of less than $1.5 million could choose to bid for the 8.2% of the inner ring, or 36.5% of the outer ring market.
House price growth in 2021 'more than made up' for the negative trend in 2017, as prices have been pushed to their highest levels ever.
Particularly in Sydney's inner ring, which recorded the highest annual growth of 8.5%.
The average number of days to sell property in all rings has dropped throughout 2021, but the current market still favours sellers 'heavily'.
Vacancy rates in Sydney have declined to a 'much healthier' level than that of early 2020, closer to the Real Estate Institute of Australia (REIA) 'healthy' benchmark of 3%.
Melbourne
House market growth has been 'exceptional' from 2017 to 2021, particularly in the inner ring which recorded 12% growth.
Melbourne's inner ring median house price is currently $1,590,000, making it the 'most expensive' spot for buyers.
The inner ring unit market is showing signs of recovery as it is evident people are shifting back to living in the city.
Vacancy rates have all declined closer to the REIA benchmark. Particularly, vacancy rates dropped by 3.4% in the inner ring.
The outer ring has the lowest vacancy rate of 2.9%, as well as the 'most affordable' prices, with 53.4% of sales being under $900,000. This makes it a 'good spot' for first time investors.
Rental demand is starting to increase in the inner ring of Melbourne, which will be further pushed up by international borders reopening.
Hobart
Hobart's real estate market has seen 'outstanding' price growth across both rings over the past five years.
Unit price growth over the past five years has been greater than house price growth (62.4% compared to 46.2%) - notable as typically houses appreciate faster than units.
Despite strong absorption rates of listings in 2021, sales volume decreased since 2017, which indicates a low level of supply. This is fuelling 'strong' price growth.
Rental yields have compressed over the past 12 months, despite growth in rental prices, because property price growth has surpassed rental price growth.
Hobart recorded 'incredibly low' vacancy rates in both its inner and middle ring suburbs, which indicates quick occupancy and rental cashflow.
According to the report, buyers have a better chance of finding an affordable property in Hobart's middle ring, but that they must be quickly to purchase as the average vendor premiums to purchase a property have been increasing to an all time high in 2021.
Advertisement
Buying a home or looking to refinance? The table below features home loans with some of the lowest interest rates on the market for owner occupiers.
| Lender | Home Loan | Interest Rate | Comparison Rate* | Monthly Repayment | Repayment type | Rate Type | Offset | Redraw | Ongoing Fees | Upfront Fees | Max LVR | Lump Sum Repayment | Extra Repayments | Split Loan Option | Tags | Features | Link | Compare | Promoted Product | Disclosure |
|---|---|---|---|---|---|---|---|---|---|---|---|---|---|---|---|---|---|---|---|---|
5.54% p.a. | 5.58% p.a. | $2,852 | Principal & Interest | Variable | $0 | $530 | 90% |
| Promoted | Disclosure | ||||||||||
5.49% p.a. | 5.40% p.a. | $2,836 | Principal & Interest | Variable | $0 | $0 | 80% |
| Promoted | Disclosure | ||||||||||
5.64% p.a. | 5.89% p.a. | $2,883 | Principal & Interest | Variable | $250 | $250 | 60% |
| Promoted | Disclosure | ||||||||||
5.64% p.a. | 5.89% p.a. | $2,883 | Principal & Interest | Variable | $248 | $350 | 60% |
| Disclosure |
Image by Joshua Willson on Unsplash

Ready, Set, Buy!
Learn everything you need to know about buying property – from choosing the right property and home loan, to the purchasing process, tips to save money and more!
With bonus Q&A sheet and Crossword!



 Bea Garcia
 Denise Raward
 Harry O'Sullivan
 Rachel Horan