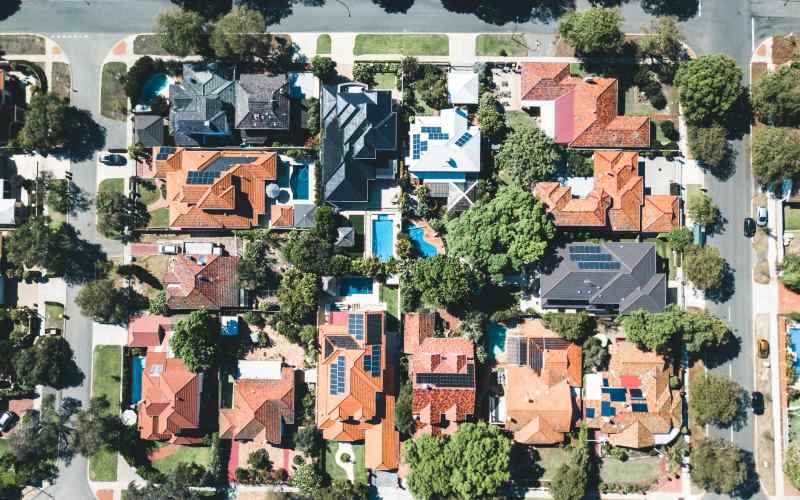
From coast to coast, Australia property values saw monthly gains, with nearly all broad regions joining the uptrend.
Australian home values rose 1.4% in the June quarter, accelerating after a 0.9% gain earlier this year and recovering from a modest 0.1% decline in the final quarter of last year, according to the newest data released by Cotality (formerly CoreLogic).
Cotality Research Director Tim Lawless notes that the recent interest rate reductions have been driving a shift in the housing market.
"The first rate cut in February was a clear turning point for housing value trends. An additional cut in May, and growing certainty of more cuts later in the year have further fuelled positive housing sentiment, pushing values higher," he said.
Sales remain soft while housing prices climb
Despite slower-than-average home sales, the housing market continues to post steady price growth.
"Although demonstrated demand is tracking slightly below average, advertised supply is scarce, creating a more balanced market for buyers and sellers," Mr Lawless said.
Housing turnover in the first half of the year, based on estimates of sales and total dwelling stock, is running at an annualized rate of 4.9%, just below the decade-average of 5.1%.
Meanwhile, advertised property listings are down 5.8% compared to last year and 16.7% below the previous five-year average, reflecting tight supply conditions.
Conditions align for housing market boost in second half of year
Interest rates are expected to settle within the high 2% to early 3% bracket by year's end, potentially lowering mortgage costs for millions of homeowners and boosting property demand.
Economists now predict a 25 basis point cut on 8 July, with financial markets pricing the cash rate at 3.1% by December and 2.9% by early 2026, easing borrowing costs.
Housing supply remains tight, with advertised listings down 5.8% year-on-year and 16.7% below the five-year average, supporting ongoing upward pressure on home values.
"Lower debt servicing costs, along with reduced cost-of-living pressures, should support consumer sentiment and high commitment decision making, working in favour of housing demand," Mr Lawless said.
Housing price hotspots
Capital cities outpaced regional markets in monthly growth for the second straight month, signalling a shift after a period of regional outperformance.
Although regional areas still lead on a quarterly basis with 1.6% growth versus 1.4% in the capitals, the trend is tilting back in favor of the cities.
Darwin led quarterly growth among the capitals, with dwelling values jumping 4.9% and finally hitting a new record high, surpassing the 2014 peak. The median value in Darwin now sits at $537,471.
Perth and Brisbane followed, rising 2.1% and 2.0% respectively for the quarter, maintaining their lead in five-year growth, with values up 81.1% and 75.1% respectively since mid-2020. Median dwelling values now stand at $819,885 in Perth and $926,243 in Brisbane.
As of 30 June 2025, this table outlines the change in dwelling values and corresponding index results:
|
Region |
Month |
Quarter |
Annual |
Total return |
Median value |
|
Sydney |
0.6% |
1.1% |
1.3% |
4.3% |
$1,210,222 |
|
Melbourne |
0.5% |
1.1% |
-0.4% |
3.3% |
$796,952 |
|
Brisbane |
0.7% |
2.0% |
7.0% |
10.9% |
$926,243 |
|
Adelaide |
0.5% |
1.1% |
8.0% |
12.0% |
$837,176 |
|
Perth |
0.8% |
2.1% |
7.0% |
11.6% |
$819,885 |
|
Hobart |
-0.2% |
0.9% |
2.0% |
6.4% |
$677,390 |
|
Darwin |
1.5% |
4.9% |
6.0% |
13.0% |
$537,471 |
|
Canberra |
0.9% |
1.3% |
0.3% |
4.3% |
$855,197 |
|
Combined capitals |
0.6% |
1.4% |
2.7% |
6.2% |
$918,408 |
|
Combined regional |
0.5% |
1.6% |
5.5% |
10.1% |
$685,193 |
|
National |
0.6% |
1.4% |
3.4% |
7.1% |
$837,586 |
Advertisement
Buying a home or looking to refinance? The table below features home loans with some of the lowest interest rates on the market for owner occupiers.
| Lender | Home Loan | Interest Rate | Comparison Rate* | Monthly Repayment | Repayment type | Rate Type | Offset | Redraw | Ongoing Fees | Upfront Fees | Max LVR | Lump Sum Repayment | Extra Repayments | Split Loan Option | Tags | Features | Link | Compare | Promoted Product | Disclosure |
|---|---|---|---|---|---|---|---|---|---|---|---|---|---|---|---|---|---|---|---|---|
5.54% p.a. | 5.58% p.a. | $2,852 | Principal & Interest | Variable | $0 | $530 | 90% |
| Promoted | Disclosure | ||||||||||
5.49% p.a. | 5.40% p.a. | $2,836 | Principal & Interest | Variable | $0 | $0 | 80% |
| Promoted | Disclosure | ||||||||||
5.64% p.a. | 5.89% p.a. | $2,883 | Principal & Interest | Variable | $250 | $250 | 60% |
| Promoted | Disclosure | ||||||||||
5.64% p.a. | 5.89% p.a. | $2,883 | Principal & Interest | Variable | $248 | $350 | 60% |
| Disclosure |
Photo by Bailey Rytenskild on Unsplash

Ready, Set, Buy!
Learn everything you need to know about buying property – from choosing the right property and home loan, to the purchasing process, tips to save money and more!
With bonus Q&A sheet and Crossword!


 Harrison Astbury

 Brooke Cooper

