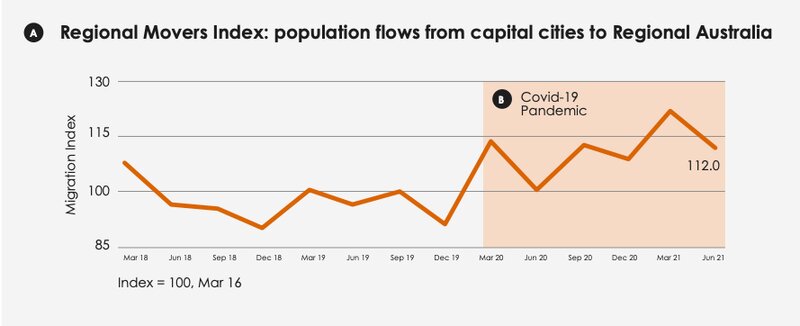
According to the June quarter Regional Movers Index, there was an 11% rise in the number of people moving from capital cities to regional areas compared to June quarter 2020.
The report shows that the largest growth in metro-movers were in regional centres within three hours of Melbourne - the capital city that has endured the longest lockdowns.
Commonwealth Bank’s Executive General Manager for Regional and Agribusiness Banking, Grant Cairns, said that soaring house prices and with many now working from home, moving regional has become a realistic option.
"The experience of lockdowns is front of mind for Victorians, so the desire to seek a tree change is rapidly growing. It is positive to see the development of infrastructure - particularly in regional areas – is growing to meet the increased demand," Mr Cairns said.
Source: RAI
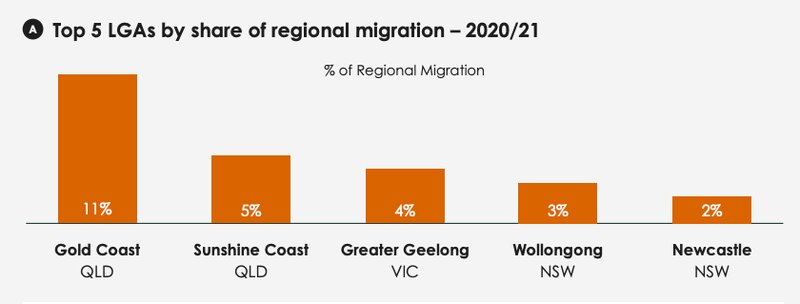
Key migration patterns by state in 2020/21:
Melbourne saw its share of net capital city outflows increase to 47%, from 39% a year earlier.
Sydney still had the highest share of net capital city outflows at 49% and regional NSW picked up the largest share of net migration into regional Australia (34%).
Regional Queensland's share of net migrants from capital cities grew to 28%, while the shares of both regional NSW and regional Victoria shrank.
Tasmania and South Australia each saw an increase in regional settlement with a 4% and 6% share, respectively.
Perth was the only capital to see more people moving into the city than leaving, while regional WA’s share of net regional migration rose to three per cent from 1% a year earlier.
Regional Housing Squeeze
RAI's Chief Economist Dr Kim Houghton said the index also identifies which regional areas are emerging as desirable destinations.
"This enables local leaders and business owners to prepare for a burst of population growth," Dr Houghton said.
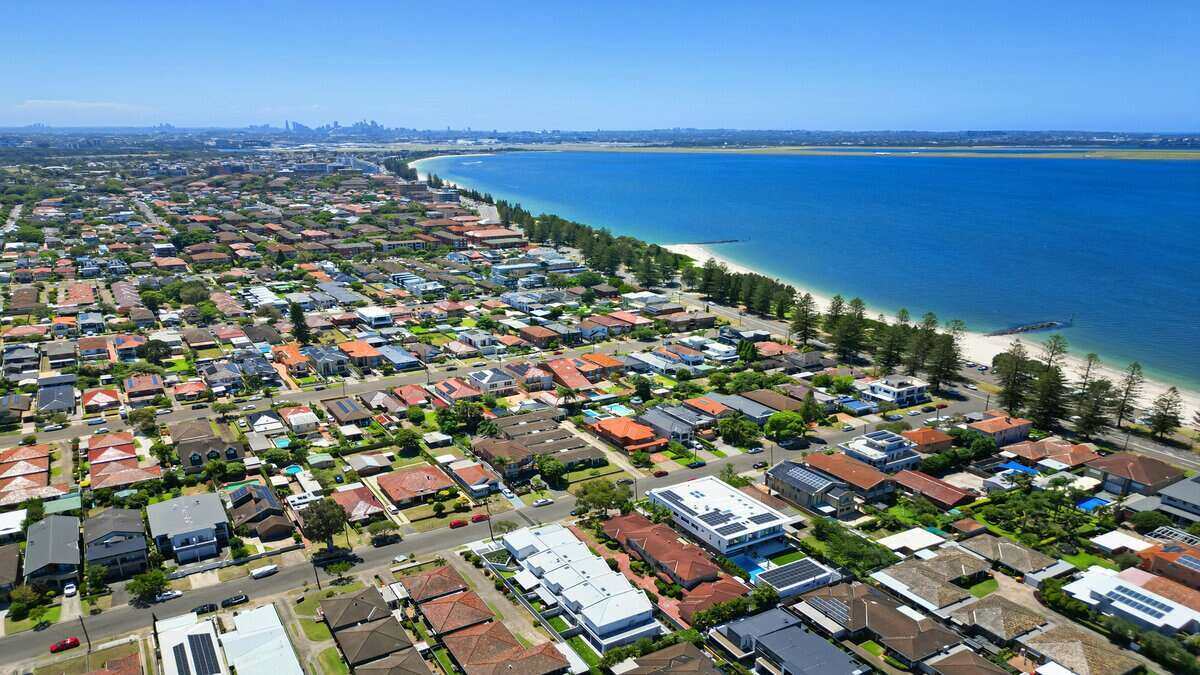
The housing squeeze caused by city goers looking for a tree change is also impacting regional communities as rental markets become more competitive and expensive.
"We can also see that the number of regional residents choosing to stay put has increased, which is likely to be contributing to the housing squeeze in some areas," Dr Houghton said.
Source: RAI
Advertisement
Buying a home or looking to refinance? The table below features home loans with some of the lowest interest rates on the market for owner occupiers.
| Lender | Home Loan | Interest Rate | Comparison Rate* | Monthly Repayment | Repayment type | Rate Type | Offset | Redraw | Ongoing Fees | Upfront Fees | Max LVR | Lump Sum Repayment | Extra Repayments | Split Loan Option | Tags | Features | Link | Compare | Promoted Product | Disclosure |
|---|---|---|---|---|---|---|---|---|---|---|---|---|---|---|---|---|---|---|---|---|
5.54% p.a. | 5.58% p.a. | $2,852 | Principal & Interest | Variable | $0 | $530 | 90% |
| Promoted | Disclosure | ||||||||||
5.49% p.a. | 5.40% p.a. | $2,836 | Principal & Interest | Variable | $0 | $0 | 80% |
| Promoted | Disclosure | ||||||||||
5.64% p.a. | 5.89% p.a. | $2,883 | Principal & Interest | Variable | $250 | $250 | 60% |
| Promoted | Disclosure | ||||||||||
5.64% p.a. | 5.89% p.a. | $2,883 | Principal & Interest | Variable | $248 | $350 | 60% |
| Disclosure |


")

Image by City of Gold Coast via Unsplash

Ready, Set, Buy!
Learn everything you need to know about buying property – from choosing the right property and home loan, to the purchasing process, tips to save money and more!
With bonus Q&A sheet and Crossword!

 Harry O'Sullivan
 Harrison Astbury
 Denise Raward
 Brooke Cooper