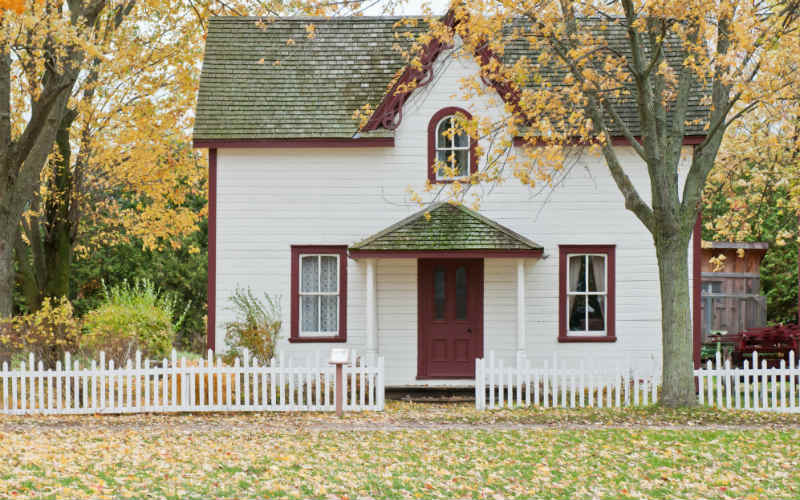
The latest data from InvestorKit identified 11 regions across the country that would be most impacted by a housing supply shortage, both in the short term and medium term.
These include: Brisbane Inner (North) and Toowoomba in QLD; Camden, Penrith, Albury-Wodonga, and Wagga Wagga in NSW; Tuggeranong in ACT; and Prospect-Walkerville, Charles Sturt, Mount Gambier, and Onkaparina in SA.
InvestorKit Head of Research Arjun Paliwal said the solution to Australia’s housing crisis isn’t as simple as building new homes and hoping the issue will resolve.
“A combination of many existing and emerging problems have contributed to the housing supply crunch,” Mr Paliwal said.
“To resolve Australia's housing supply shortage issue, we need a more even distribution of population, a more efficient planning system, a fairer tax system to encourage stock mobility, more investor-friendly policies, higher diversity in housing providers, and more, which would take a long time to achieve.”
The nine ingredients contributing to supply woes
Mr Paliwal identified nine areas contributing to Australia's housing supply woes.
- Net migration adding to rental demand
- Average household size declining
- Difficulties in unlocking new land supply
- Delay in development approvals
- The concentration of population in major cities and on the coast
- Australians holding onto properties for longer
- Delays in construction due to material costs and shortages
- Labour shortages
- A suppression of investor activity
Although the National Housing Accord, introduced in last month’s Federal Budget is set to tackle housing supply woes, Mr Paliwal believes the plans will not be enough to curb the rental crisis or housing supply issue.
"An announcement of 10,000 places here and there or similar building trends over the last five years being repeated isn’t enough," he said.
"Many fail to understand that we are to see circa 200,000 incoming migrants with the cap lift each year and that Australia typically sees 450,000-550,000 housing transactions per year."
The 11 regions facing supply constraints in 2023
InvestorKit analysed more than 300 statistical area level 3 (SA3) regions to determine the most impacted.
For each of the regions, InvestorKit provided a Supply Shortage Score (SSS) out of five based on factors including established supply risk, future supply risk, people movement, housing availability, rental pressure, and price pressure.
A higher score means more supply woes.
1. Brisbane Inner (North) - 4.7/5
- Population growth: increased by 26.1% between 2012-2021
- Total number of for-sale listings: fell by 44% between 2012-2021
- Building approvals: last year’s total number only represented 0.78% of all houses
- Current volume of stock on market: 1.18% compared to the region’s total house stock
- Current rental vacancy: 0.7%
2. Toowoomba - 4.3/5
- Population growth: increased by 9.8% between 2012-2021
- Total number of for-sale listings: fell by 39.3% between 2012-2021
- Building approvals: last year’s total number only represented 1.71% of all houses
- Current volume of stock on market: 0.77% compared to the region’s total house stock
- Current rental vacancy: hovering at an extremely low level for the last few years
3. Camden - 4.7/5
- Population growth: increased by 35.7% between 2012-2021
- Total number of for-sale listings: fell by 24.8% between 2012-2021
- Building approvals: last year’s total number only represented 1.23% of all houses
- Current volume of stock on market: 0.83% compared to the region’s total house stock
4. Penrith - 4.5/5
- Population growth: increased by 21.9% between 2012-2021
- Total number of for-sale listings: only risen by 2.3% between 2012-2021
- Building approvals: last year’s total number only represented 1.56% of all houses. This is approximately half the figure in 2018
- Current volume of stock on market: 0.83% compared to the region’s total house stock
- Current rental vacancy: below 1% for the past 12 months
5. Albury-Wodonga - 4.4/5
- Population growth: increased by 6.7% between 2012-2021
- Total number of for-sale listings: dropped by a dramatic 65.9% between 2012-2021
- Current volume of stock on market: 0.82% compared to the region’s total house stock
- Demand for sales volumes: declined by 20.4%
6. Wagga Wagga - 4.3/5
- Population growth: increased by 5.6% between 2012-2021
- Total number of for-sale listings: down 66.9% between 2012-2021
- Building approvals: this year’s total number only represented 1.52% of all houses which has done little to ease the housing crunch
- Current volume of stock on market: 0.68% compared to the region’s total house stock
7. Mount Gambier - 4.5/5
- Population growth: increased by 5.8% between 2012-2021
- Total number of for-sale listings: down 31.9% year on year
- Building approvals: last year’s total number only represented 1.48% of all houses which is not enough to relieve the city’s supply crisis
- Current volume of stock on market: 0.48% compared to the region’s total house stock
- Current rental vacancy: below 1% for the past two years
8. Prospect-Walkerville - 4.3/5
- Population growth: increased by 6.1% between 2012-2021
- Total number of for-sale listings: only risen by 6% between 2012-2021
- Current volume of stock on market: 0.78% compared to the region’s total house stock
- House price growth: August 2021 to August 2022 saw the median house price increase by 44%
- Current rental vacancy: 0.6%
9. Charles-Sturt - 4.3/5
- Population growth: increased by 10% between 2012-2021
- Total number of for-sale listings: decreased by 40.2% between 2012-2021
- Building approvals: with around 600 new building approvals this year, representing 1.92% of all houses, it is not enough to ease the tension
- Current volume of stock on market: 0.84% compared to the region’s total house stock
- Current rental vacancy: 0.3%
10. Onkaparinga - 4.3/5
- Population growth: increased by 6.5% between 2012-2021
- Total number of for-sale listings: trending down over the past decade
- Current volume of stock on market: 0.64% compared to the region’s total house stock
- Current rental vacancy: 0.2%
11. Tuggeranong - 4.3/5
- Population growth: increased by 3.9% over the last five years
- Building approvals: this year’s total number only represented 0.19% of all houses
- Current volume of stock on market: 0.46% compared to the region’s total house stock
- Current rental vacancy: 0.5% over the past 12 months
Image by Joel Henry via Unsplash

Ready, Set, Buy!
Learn everything you need to know about buying property – from choosing the right property and home loan, to the purchasing process, tips to save money and more!
With bonus Q&A sheet and Crossword!


 Harry O'Sullivan
 William Jolly