Australia's national rental vacancy remains at a 'multi-year low' of 1.6% in August, which is the lowest vacancy rate recorded since March 2011.
SQM Research revealed that there were 58,856 vacant residential rental properties recorded in August, which is down from the 61,313 vacancies in July.
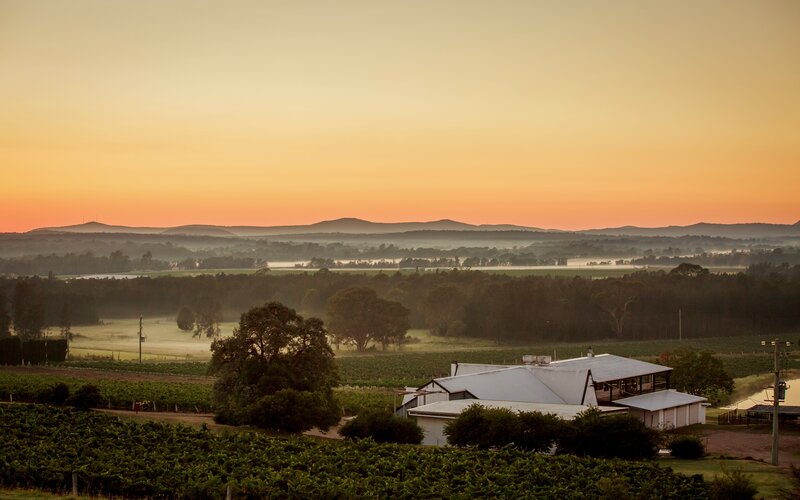
Vacancy rates fell in regional areas, including the Blue Mountains and NSW North Coast, which signal that 'harsh capital city lockdowns' are causing people to flee, according to SQM Research's data.
In August, Adelaide, Canberra, Perth, Darwin, and Hobart all recorded vacancy rates below 1%, and Brisbane's vacancy rate remained constant.
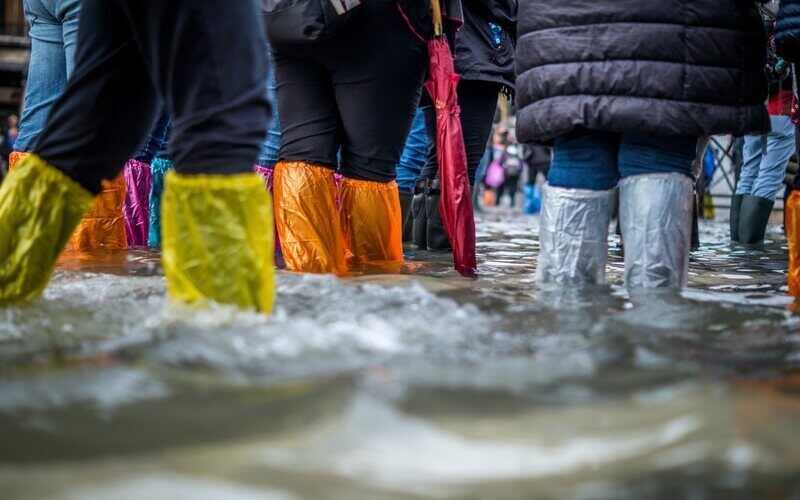
However, vacancy rates have risen in the lockdown-stricken capital cities of Sydney and Melbourne.
Sydney CBD's rental vacancy rate rose to 7.8%, and Melbourne CBD saw rental vacancies increase to 8.3%.
Asking rental price hike
Over the past 12 months, rental asking prices have risen by 1.3% for houses, up to $533 per week.
Asking prices are rose by 0.2% for units to $402 per week.
This was driven by hikes to asking prices in regional areas, rather than capital cities, according to SQM's data.
Rent prices remained steady in capital cities over the past 30 days, and are up 9.1% over the past year.
Unit rental prices also rose by 0.2% over the past 30 days, and are up 1.9% over the past year.
SQM Research revealed that rents rose for most regions around the country.
Specifically, North Coast NSW saw a rise of 4.2% in the last month.
Additionally, rental asking prices rose by 6.7% in the Blue Mountains; 4.8% for houses in the Mornington Peninsula; and 8.2% for houses in Toowoomba.
Lockdowns 'triggered' spike in demand for regional living
SQM Research's release stated that it believes lockdowns may have caused an uptick in interest for regional living due to people 'seeking freedom'.
Louis Christopher, Managing Director of SQM Research, said there are 'strong signs' current lockdowns are responsible for the fresh wave of interest in regional property.
"SQM Research has recorded new falls in rental vacancy rates across many of our regions, while at the same time, CBD rental vacancy rates have surged again over August," Mr Christopher said.
"While it is true that a number of regional areas have been in lockdown, it has been perceived that the regional lockdowns have not been as harsh or as widespread compared to the city-wide restrictions."
Mr Christopher anticipates that vacancy rates will fall again in September.
"Weekly listing updates through to the 12th September suggest a further tightening of conditions, so it is reasonable to expect another surge in rents in most areas except for the CBD locations," he said.
Image by Lynda Hinton on Unsplash

Ready, Set, Buy!
Learn everything you need to know about buying property – from choosing the right property and home loan, to the purchasing process, tips to save money and more!
With bonus Q&A sheet and Crossword!


 Denise Raward
 Harry O'Sullivan
 Bea Garcia
 Harrison Astbury
 Rachel Horan