The report is based on data collected from property research firm Suburbtrends which revealed in all the suburbs identified in the top 20, rents have increased at least 33% during the past 12 months.
Vacancy rates are under 1% and in some cases at 0% in all 20 suburbs.
Hood.ai founder and CEO Tommy Fraser said this report highlights the issue of rental affordability, which has received plenty of coverage throughout the federal election campaign.
“Traditionally, when renters get priced out of an area, they tend to shift to a cheaper suburb nearby, but that’s become increasingly hard in the current market, which is forcing tenants to move even further in search of affordable accommodation," Mr Fraser said.
“If you live in any of the suburbs mentioned in this report, take note, because there’s a strong chance your landlord will increase your rent at the next rental review.”
The report features suburbs spread primarily across regional locations, with only three lying within capital cities.
New South Wales recorded the highest number with eight suburbs, while Tasmania, South Australia and the Australian Capital Territory did not make the list.
Top 20 suburbs tipped to increase rent
| Rank | Suburb | Property Type | Median Weekly Rent | Annual Rent Increase |
| 1 | Bogangar, NSW, 2488 | Unit | $650 | 52.9% |
| 2 | Burrum Heads, QLD, 4659 | House | $500 | 51.5% |
| 3 | Avoca, QLD, 4670 | Unit | $330 | 50.0% |
| 4 | Hastings Point, NSW, 2489 | Unit | $650 | 47.7% |
| 5 | Paradise Point, QLD, 4216 | House | $745 | 47.5% |
| 6 | Leeming, WA, 6149 | Unit | $450 | 45.2% |
| 7 | Tarrawanna, NSW, 2518 | House | $750 | 44.2% |
| 8 | Colo Vale, NSW, 2575 | House | $600 | 42.9% |
| 9 | Brunswick Heads, NSW, 2483 | House | $795 | 42.0% |
| 10 | Howard Springs, NT, 0835 | House | $695 | 41.8% |
| 11 | Beechboro, WA, 6063 | Unit | $380 | 40.7% |
| 12 | Cooma, NSW, 2630 | Unit | $330 | 40.4% |
| 13 | Kambalda West, WA, 6442 | House | $280 | 40.0% |
| 14 | Sussex Inlet, NSW, 2540 | Unit | $415 | 38.3% |
| 15 | Chelmer, QLD, 4068 | House | $685 | 37.0% |
| 16 | Kahibah, NSW, 2290 | House | $600 | 36.4% |
| 17 | Rochester, VIC, 3561 | House | $380 | 35.7% |
| 18 | Chuwar, QLD, 4306 | House | $430 | 34.4% |
| 19 | Quindalup, WA, 6281 | House | $670 | 34.0% |
| 20 | Pomoma, QLD, 4568 | House | $600 | 33.3% |
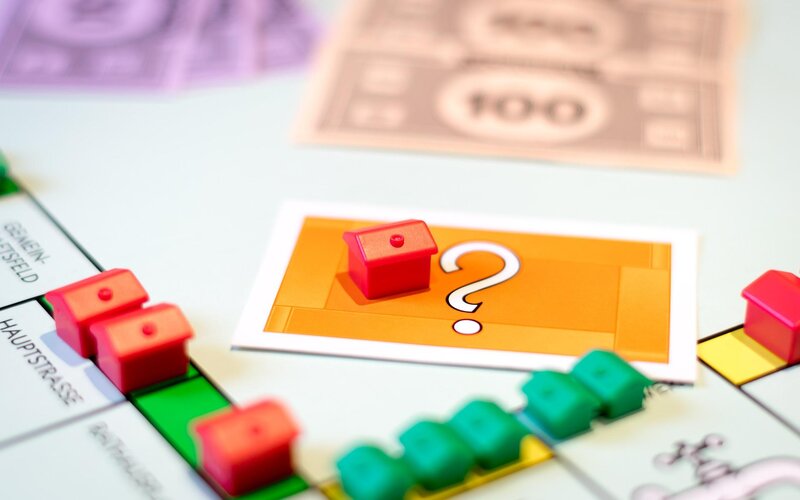
Image by JHertle via Pixabay

Ready, Set, Buy!
Learn everything you need to know about buying property – from choosing the right property and home loan, to the purchasing process, tips to save money and more!
With bonus Q&A sheet and Crossword!


 Harry O'Sullivan
 Denise Raward
 Alex Brewster
 Harrison Astbury