
The Australian Bureau of Statistics Selected Living Cost Indexes (LCI) data for the March 2019 quarter show a very slight increase in living pressures across the five different types of households measured:
Household types | Quarterly change (Dec 18 to Mar 19) | Annual change (Mar 18 to Mar 19) |
|---|---|---|
| Pensioners and beneficiaries | 0.3% | 1.6% |
| Employees | 0.0% | 1.4% |
| Aged pensioners | 0.3% | 1.4% |
| Other government transfer recipients | 0.2% | 1.6% |
| Self-funded retirees | -0.2% | 1.6% |
| Consumer Price Index (CPI) | 0.0% | 1.3% |
Source: ABS
The data shows the largest quarterly increase in the cost of living was just 0.3% for pensioners and aged pensioners, while self-funded retirees actually saw their cost of living decrease.
However on a yearly basis, all household groups recorded an increase of 1.4%-1.6%, which is higher than the consumer price index of 1.3%.
These results are much quieter than the previous quarter’s, which can be seen in the table below.
| Household type | Annual change (Dec 17 to Dec 18) | Quarterly change (Sept 18 to Dec 18) |
| Employees | 1.9% | 0.6% |
| Age Pensioners | 2.0% | 0.4% |
| Self-funded retirees | 2.2% | 0.5% |
| Other govt transfer recipients | 2.1% | 0.9% |
| CPI (inflation) | 1.8% | 0.5% |
Source: ABS
The LCI research breaks down the cost of living for these household groups based on their largest sources of income.
For example, a greater weight is applied to health costs for aged pensioners, while the cost of things like transport and recreation are given greater importance to employees, who are more likely to be younger.
Opposition leader Bill Shorten recently said “everything is going up in Australia except for people’s wages”
But Australia’s rate of wage growth is currently sitting at 2.3% per annum, which is higher than the annual cost of living index results for all types of households.
This is of little comfort to those who don’t work, however, such as the increasing number of pensioners in the country.
What caused these changes?
Aged pensioners
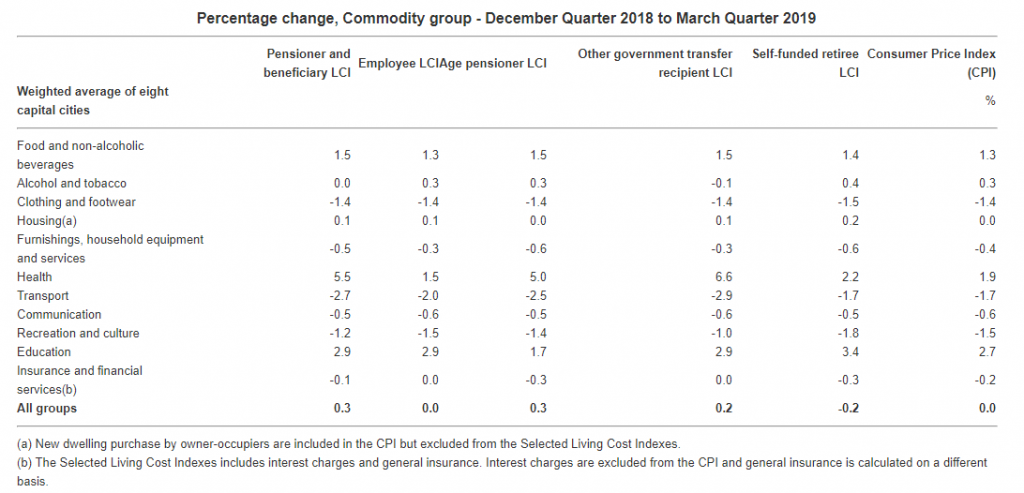
Aged pensioners saw a 0.3% LCI increase over the quarter after a 0.4% rise in the December quarter.
This most recent increase was mostly due to health costs (+5.0%) thanks to increased costs of pharmaceutical products and medical services, while vegetable prices also increased leading to a 1.5% increase in the cost of food and non-alcoholic drinks.
Employees
Australia’s workforce saw no change to the cost of living over the March quarter and a 1.4% increase annually.
The commencement of the new school year saw education costs rise over the quarter by 2.9%, while the next biggest positive contributor was food and non-alcohol drinks (1.3%).
This was dragged down however by falling fuel prices, which caused overall transport costs to decline by 2% – in February the ACCC reported fuel prices hitting their lowest point in more than a year.
Cheaper domestic holidays and accommodation also saw recreation and culture costs fall by 1.5% for employees, leaving their quarterly LCI at a flat 0%.
Government recipients
People such as those on Centrelink benefits experienced a meagre 0.2% increase in the cost of living in the March quarter.
Their reasons were much the same as those on the aged pension: health costs rose by 6.6% due to pharmaceutical products and hospital services, while food and non-alcohol increased by 1.5%.
World oil prices contributed to a 2.9% fall in transport costs for government recipients.
Year-on-year their cost of living rose by 1.6%.
Self-funded retirees
Self-funded retirees were the only household group to experience a decline in the cost of living, falling by 0.2%. Recreation and culture (-1.8%) and transport (-1.7%) both contributed to the decline, as did falling clothing and footwear costs (-1.5%).
Health (+2.2%) and Food and non-alcoholic beverages (+1.4%) were the most significant positive contributors this quarter.


 Denise Raward
 Harry O'Sullivan


 William Jolly