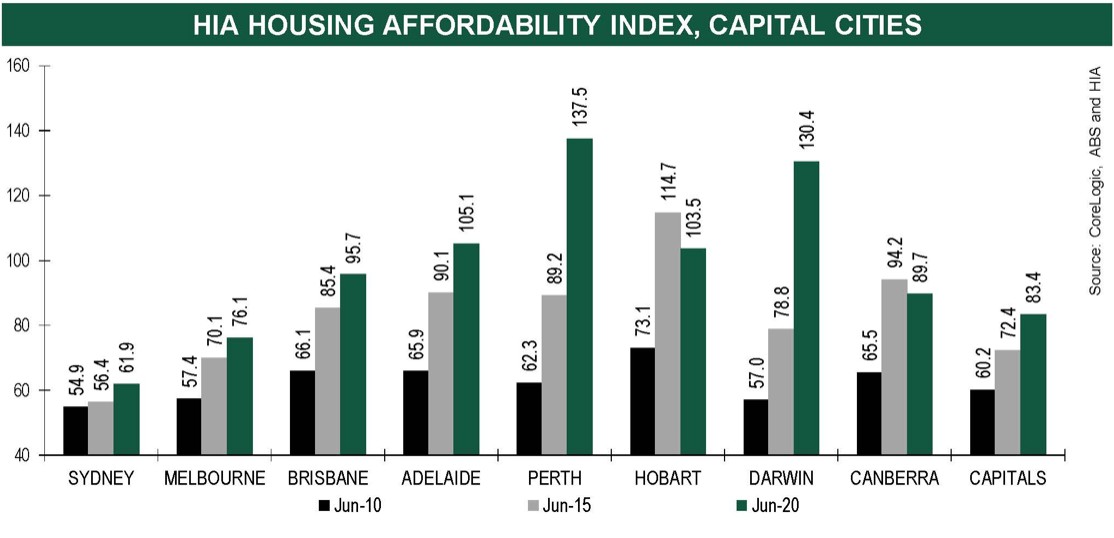
The Housing Industry Association's (HIA) housing affordability index for the capital cities increased by 5.6%, led by Perth, accelerating 7.1% on the quarter.
Sydney's affordability also increased by 6.1%, and HIA's chief economist Tim Reardon says Australian housing costs are at their most serviceable since 1999, when loan interest and other expenses are taken into account.
“Repaying a mortgage is no longer the constraint it was over the past two decades," he said.
“The combination of lower interest rates, slow house price growth and relatively steady wage growth over the past three years have driven this improvement in affordability.
Wage growth turned negative in June for the first time in 20 years, while real wage growth was just 0.2% in May.
HIA's housing affordability index is a calculation based on a mixture of qualifying income and mortgage costs and whether they are more or less than 30% of income.
Building a home? The table below features construction home loans with some of the lowest variable interest rates on the market for owner-occupiers.
| Lender | Home Loan | Interest Rate | Comparison Rate* | Monthly Repayment | Repayment type | Rate Type | Offset | Redraw | Ongoing Fees | Upfront Fees | Max LVR | Lump Sum Repayment | Extra Repayments | Split Loan Option | Tags | Features | Link | Compare | Promoted Product | Disclosure |
|---|---|---|---|---|---|---|---|---|---|---|---|---|---|---|---|---|---|---|---|---|
5.93% p.a. | 6.19% p.a. | $2,471 | Interest-only | Variable | $0 | $530 | 90% |
| Promoted | Disclosure | ||||||||||
5.69% p.a. | 5.71% p.a. | $2,899 | Principal & Interest | Variable | $0 | $350 | 80% | Disclosure | ||||||||||||
5.94% p.a. | 6.00% p.a. | $2,475 | Interest-only | Variable | $0 | $835 | 90% | |||||||||||||
6.24% p.a. | 6.31% p.a. | $2,600 | Interest-only | Variable | $0 | $450 | 80% | |||||||||||||
6.44% p.a. | 6.41% p.a. | $2,683 | Interest-only | Variable | $0 | $530 | 90% | |||||||||||||
6.74% p.a. | 7.51% p.a. | $2,808 | Interest-only | Variable | $20 | $644 | 90% | |||||||||||||
7.89% p.a. | 8.22% p.a. | $3,631 | Principal & Interest | Variable | $0 | $0 | 75% | |||||||||||||
7.19% p.a. | 6.90% p.a. | $2,996 | Interest-only | Variable | $0 | $1,212 | 90% | |||||||||||||
8.18% p.a. | 8.25% p.a. | $3,732 | Principal & Interest | Variable | $0 | $900 | 80% | |||||||||||||
5.94% p.a. | 6.36% p.a. | $2,978 | Principal & Interest | Variable | $395 | $null | 95% | |||||||||||||
5.18% p.a. | 5.63% p.a. | $2,739 | Principal & Interest | Variable | $350 | $0 | 90% |


Mr Reardon said it takes just 1.2 average incomes to service a mortgage on a median-priced dwelling in Australia's capitals.
“This is a rapid improvement from just three years ago when it required more than 1.4 times the average income to service the same mortgage," he said.
Meanwhile, today's Australian Bureau of Statistics data reveals construction activity was flat in the June quarter, down 0.7%.
Westpac's senior economist Andrew Hanlan said this was an "upside surprise".
"Westpac [predicted] -3.4% and the market median at -7.0%," he said.
"By state, gains were in WA, +2.9%, and NT, +25.6%, presumably led higher by mining infrastructure. NSW also advanced, up by 1.4%."
Residential building also slowed, down to its lowest value level since the June 2014 quarter, declining 12.1% in a year, according to HIA senior economist Geordan Murray.
“The decline in home building activity can only partially be attributed to the COVID-19 disruption," he said.
"Most of the building work done during the June quarter was ongoing work on homes that were under construction at the onset of the shut-down."
This is despite the Government HomeBuilder announcement in June, which one construction software company last week said was a boon for small construction businesses.
However, Mr Murray did say that HomeBuilder stemmed "rapid deterioration" in the residential construction sector.
"The HomeBuilder program created an incentive sufficient for homebuyers to return to the market," he said.
"In most markets, the lift in sales throughout June and July has made up for the drop in of sales during the lockdown ... but businesses are still preparing for the challenges that lie ahead."
First home buyers struggling with red-tape 'squeeze'
While capital cities improved their affordability over the June quarter, according to the HIA, first home buyers are still feeling the squeeze.
HIA's Mr Reardon says the biggest challenge for first home buyers is not servicing a mortgage, but obtaining a mortgage in the first place.
“A raft of restrictions imposed by [financial regulators] APRA and ASIC since the 2007 Global Financial Crisis has seen the number of home loans issued with a 10% deposit fall from 21% of all loans to just 7%," he said.
This is despite the Government introducing the First Home Loan Deposit Scheme, which provides guarantees for first home buyers, who can then enter the market with a 5% deposit without paying lenders mortgage insurance.
However, risk in the market could be mounting - 95% loans make up just 5% of the market, yet account for 8% of all mortgages in deferral.
Despite this, Mr Reardon echoed Reserve Bank Governor Philip Lowe's statement made earlier in the month, saying the "pendulum has swung too far".
“The additional red tape imposed in recent years means that banks are increasingly lending to those that already own a home," Mr Reardon said.
“Improving access to finance helped pull the economy out of the 1990s' recession and it can do the same for the COVID-19 recession."
Throughout the 1990s recession, the Reserve Bank cash rate was as high as 17.5%, while an average one-year term deposit yielded up to 14.9% in interest per annum, while credit growth declined by up to 1.8% in April 1992.
The median home price across the eight capital cities was also $121,260 in 1992, which adjusted for CPI inflation is a little over $235,000 today - in March 2020 the median was $690,200, making a 20% deposit cost just over $138,000.
Buying a home or looking to refinance? The table below features home loans with some of the lowest variable interest rates on the market for owner-occupiers.
| Lender | Home Loan | Interest Rate | Comparison Rate* | Monthly Repayment | Repayment type | Rate Type | Offset | Redraw | Ongoing Fees | Upfront Fees | Max LVR | Lump Sum Repayment | Extra Repayments | Split Loan Option | Tags | Features | Link | Compare | Promoted Product | Disclosure |
|---|---|---|---|---|---|---|---|---|---|---|---|---|---|---|---|---|---|---|---|---|
5.54% p.a. | 5.58% p.a. | $2,852 | Principal & Interest | Variable | $0 | $530 | 90% |
| Promoted | Disclosure | ||||||||||
5.49% p.a. | 5.40% p.a. | $2,836 | Principal & Interest | Variable | $0 | $0 | 80% |
| Promoted | Disclosure | ||||||||||
5.64% p.a. | 5.89% p.a. | $2,883 | Principal & Interest | Variable | $250 | $250 | 60% |
| Promoted | Disclosure | ||||||||||
5.64% p.a. | 5.89% p.a. | $2,883 | Principal & Interest | Variable | $248 | $350 | 60% |
| Disclosure |

")

Ready, Set, Buy!
Learn everything you need to know about buying property – from choosing the right property and home loan, to the purchasing process, tips to save money and more!
With bonus Q&A sheet and Crossword!
.jpg)

 Harry O'Sullivan