
It's fair to say 2020 hasn't been a normal year in Australia.
Starting with the bushfires in late 2019 and early 2020, our way of life was temporarily put on hold thanks to the arrival of the coronavirus.
The virus and the resulting shutdowns then led to a slew of historic, or 'unprecedented' policy announcements, such as JobKeeper, increased JobSeeker, six-month eviction moratoriums, home loan deferrals and early access to superannuation, just to name a few.
To cap off the last six months or so, Australia was earlier this month officially confirmed to be in a recession after a quarterly GDP fall of 7% in the three months to June.
Buying a home or looking to refinance? The table below features home loans with some of the lowest variable interest rates on the market for owner occupiers.
| Lender | Home Loan | Interest Rate | Comparison Rate* | Monthly Repayment | Repayment type | Rate Type | Offset | Redraw | Ongoing Fees | Upfront Fees | Max LVR | Lump Sum Repayment | Extra Repayments | Split Loan Option | Tags | Features | Link | Compare | Promoted Product | Disclosure |
|---|---|---|---|---|---|---|---|---|---|---|---|---|---|---|---|---|---|---|---|---|
5.54% p.a. | 5.58% p.a. | $2,852 | Principal & Interest | Variable | $0 | $530 | 90% |
| Promoted | Disclosure | ||||||||||
5.49% p.a. | 5.40% p.a. | $2,836 | Principal & Interest | Variable | $0 | $0 | 80% |
| Promoted | Disclosure | ||||||||||
5.64% p.a. | 5.89% p.a. | $2,883 | Principal & Interest | Variable | $250 | $250 | 60% |
| Promoted | Disclosure | ||||||||||
5.64% p.a. | 5.89% p.a. | $2,883 | Principal & Interest | Variable | $248 | $350 | 60% |
| Disclosure |


")

The Australian Bureau of Statistics (ABS) today released a new series 'A series of unprecedented events', which is not a new Lemony Snicket book but rather a summary of the ways in which COVID-19 has shaped a "historic quarter" in the Australian economy.
Australian Statistician and ABS Head Dr David Gruen said: "One after another, statistical records toppled in the June quarter, demonstrating the unprecedented impact on Australia of the pandemic.”
“Measuring the impact of these events as accurately as possible provides the evidence base to enable individuals, businesses and governments to make informed decisions, as well as providing a record of how the economy responded.
“This quarter will be one that Australians won't forget,” Dr Gruen said.
Below you'll find a summary of some of the key economic indicators tracked by the ABS and how they changed over the first few months of COVID, including:
- Hours worked in the labour market and employment
- Government support to households and businesses
- Taxation revenue
- Household income
- Household spending
- Household savings
- Household borrowing and lending
[Read: How does COVID-19 compare to previous recessions?]
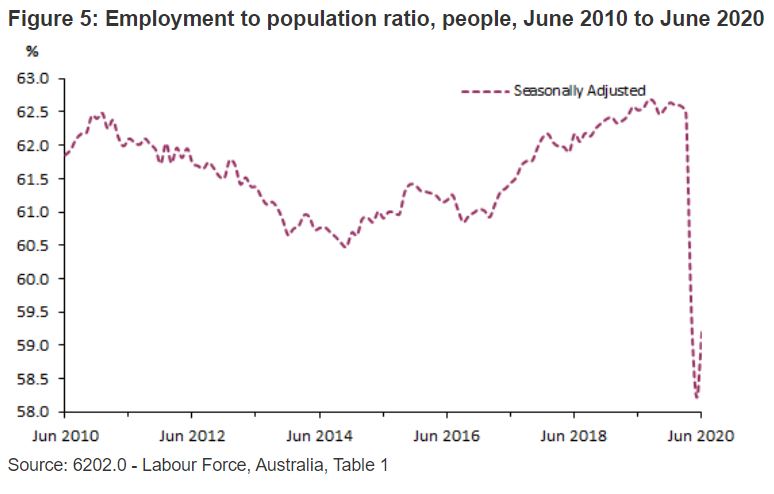
The labour market: Hours worked and employment
According to the ABS, both employment and hours worked fell significantly across the quarter.
"Throughout April, May and early June, business restrictions to slow the spread of COVID-19, social distancing and government support packages had a profound impact on the labour market," the report said.
"April saw the widespread reduction of hours worked and employees stood down. Changes to schooling arrangements may have also reduced people’s availability for work, or ability to look for work.
"By June, some of the social distancing and business restrictions were progressively relaxed or lifted."
The labour market figures revealed:
- Hours worked fell 9.8%
- Compensation of employees fell 2.5%, a smaller fall thanks to JobKeeper
- Employment fell 5.4%
- Private sector job vacancies fell by 45.0% compared to a 28.9% fall in the public sector
"April and May saw large numbers of people leaving the labour force (around 900,000 between March and April and over 700,000 between April and May in original terms).
"Between March and June, the industries with the highest proportion of payroll job losses were: Accommodation and food services (20.3%) and Arts and recreation services (18.6%)."
Government support to households and businesses
Perhaps the most well-known government response to the pandemic is the combined JobKeeper and JobSeeker schemes.
JobKeeper, as well as other schemes such as the Boosting Cash Flow for Employers policy, caused government support for businesses to skyrocket to $55.5 billion over the June quarter.
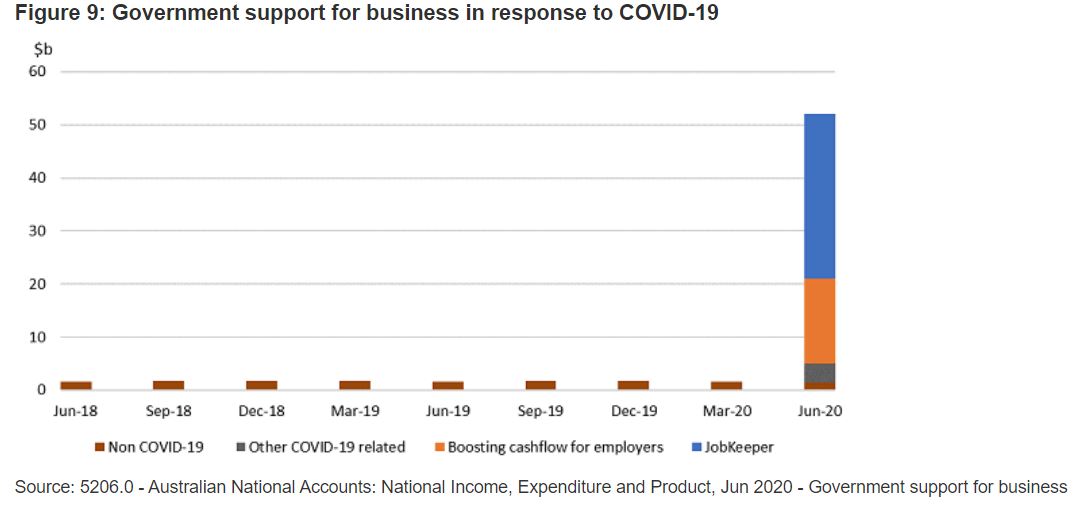
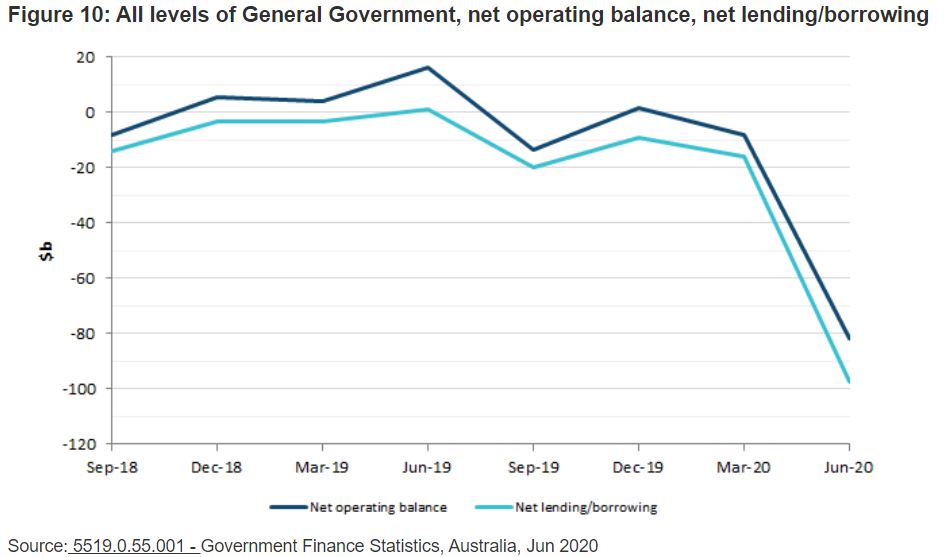
Social assistance benefits in cash (aka JobSeeker) meanwhile rose $14.4 billion, resulting in a negative Government net saving of $82.6 billion, the biggest ever recorded.
Commonwealth Government taxes fell 7.5% ($9.6 billion), mainly thanks to:
- a 19.5% fall in company income tax, driven largely by sector falls in tourism, banking, superannuation and insurance sectors; and
- a 2.2% ($1.4 billion) fall in personal income tax mainly due to lower hours worked across the economy.
State and local government taxation revenue fell 10.9% ($2.8 billion), mainly due to payroll tax relief and land tax relief for landlords.
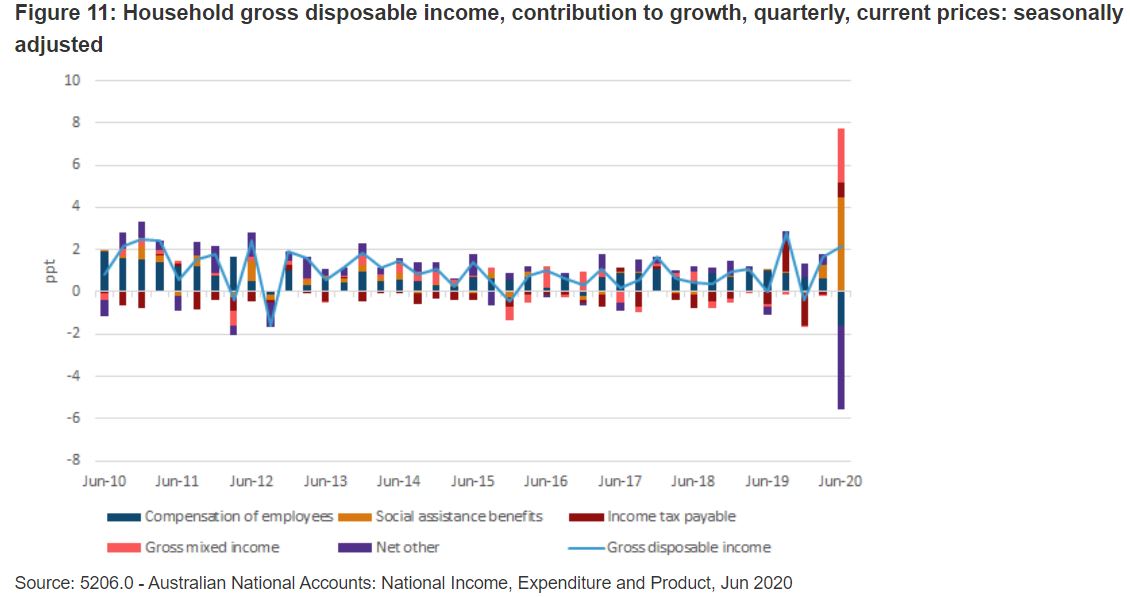
Household income
According to the ABS, household income (gross disposable income) actually rose 2.2% ($7.1 billion) during the June quarter, mainly from investment income and social assistance benefits like JobSeeker.
"The increase in social assistance recipients and additional COVID-19 support payments, including the additional COVID-19 supplement ($550 payment) and the initial Economic support payment (one-off $750 payment) saw social assistance benefits increase 41.6%."
This supports various recent surveys showing programs like JobSeeker actually lifted many Australians out of poverty.
"While the fall in hours worked (9.8%) was unprecedented, the fall in Compensation of employees (-2.5%), although a record, was less pronounced due to the JobKeeper program," the report said.
"In the June quarter, $31.0 billion in payments were made via JobKeeper, an amount exceeding the cumulative sum of all previous employment subsidies."
Household spending
Household spending decreased 12.1% in the June quarter and 2.6% in the 2019-20 financial year, the largest quarterly fall in household spending and the first annual fall ever recorded in the National Accounts.
This massive decrease can be seen in context in the graph below, and is a result of various different factors.
"In the June quarter more people worked from home, and leisure activities were also increasingly home-based, resulting in marked changes to household spending across services and goods categories," the report said.
"Services saw the largest fall in household spending (17.6%), with the consumption of goods declining 2.8%."
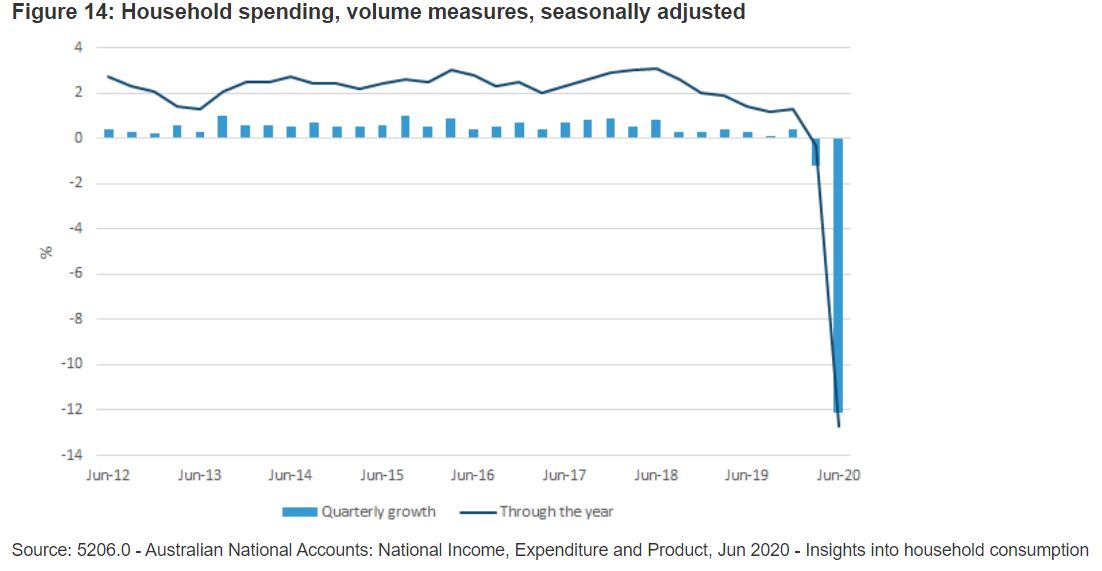
The report also notes significant falls in sectors like healthcare (25.6%) due to the temporary halt on elective surgeries, and a 40.8% fall in childcare due to the Early Childhood Education and Care Relief Package, which provided fee-free child care for households.
Meanwhile, as spending habits changed, there were actually increases in:
- Home improvement projects (29.8%);
- Spending on tools and appliances (21.1%);
- Recreation and culture such as audio-visual and exercise equipment (20.9%);
- Electricity, gas and other fuels spending rose (6.6%);
- Food (3.1%) and alcohol (17.6%)
Rents also fell 1.3%, the first quarterly fall on record.
Overall, the Consumer Price Index (CPI) fell 1.9%, the largest quarterly fall in the 72-year history of the CPI, meaning Australia is now officially in 'deflation'.
It brings the annual inflation rate to -0.3%, falling well outside the Reserve Bank's inflation target range of between 2-3%.
"Since 1949, this was only the third time annual inflation has been negative. The previous times were in 1962 and 1997-98," ABS Chief Economist Bruce Hockman said.
Household savings
Households saved nearly a fifth of their income over the June quarter, with the household savings ratio increasing massively from 2.5% to 19.8%.
According to the ABS, the combination of a rise in household income ($7.1 billion) and a fall in household spending ($35.2 billion) resulted in household net saving rising $42 billion to $59.5 billion.
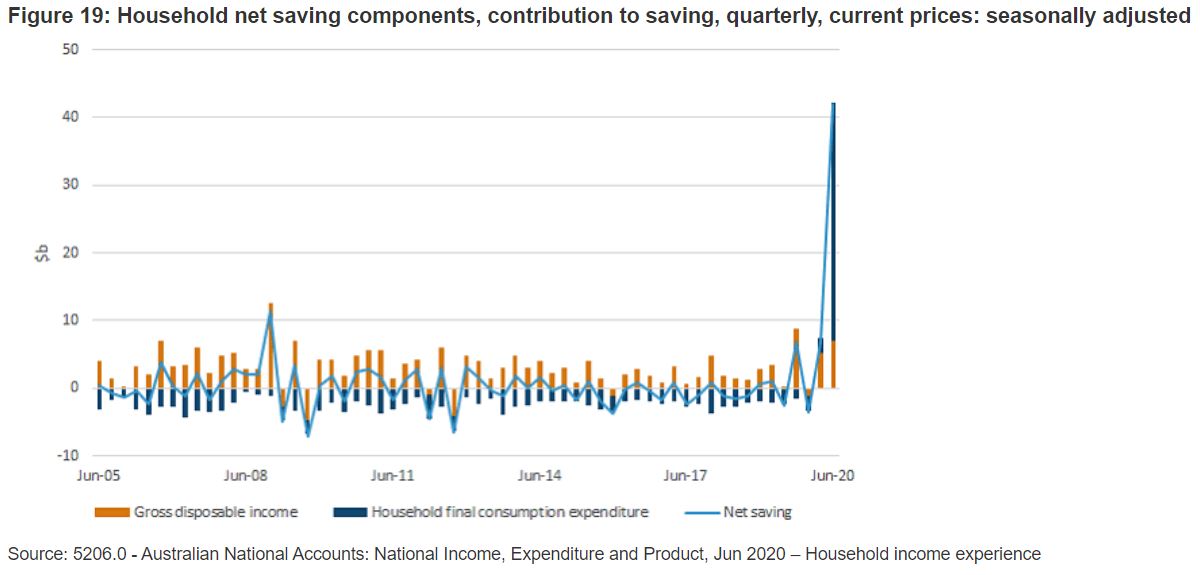
Government support payment to households like JobSeeker massively contributed to this rise in Aussies saving money over spending.
The graph below shows how much of an increase in savings this is in a historical context.
Household borrowing and lending
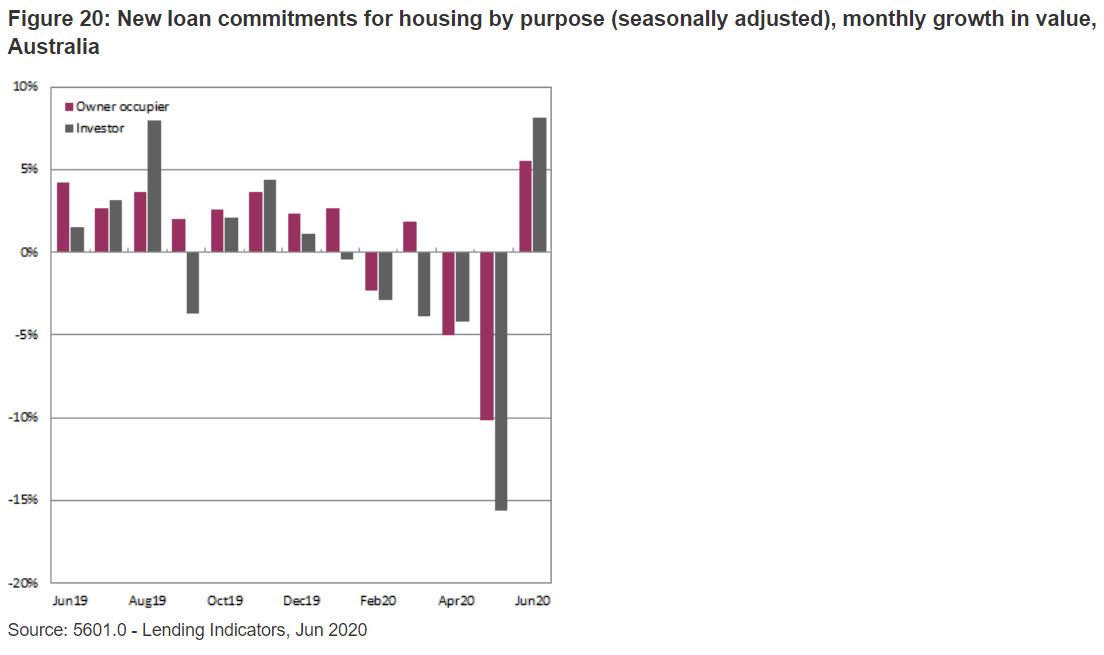
One of the biggest yo-yo datasets noticed over COVID is that of household lending for housing.
"COVID-19 restrictions and uncertainty drove a sharp decline in housing market activity that led to large falls in the value of new housing loan commitments in April and May, with the May fall (11.6%) being the largest in the history of the series," the ABS said.
"June saw some recovery with a rise of 6.2% in housing loan commitments."
Not noted in this report is the further increase in home lending in July, which rose 8.9% month-on-month.
"The value of new loan commitments for investors was particularly weak, with falls of 4.2% in April and 15.6% in May leaving the series at a historically low level."
"A bounce-back in June of 8.1% only partially moderated this weakness."
[Read: What happens to Australian house prices in a recession?]
The ABS said it will likely create another report in this series after the September quarter National Accounts results.

Ready, Set, Buy!
Learn everything you need to know about buying property – from choosing the right property and home loan, to the purchasing process, tips to save money and more!
With bonus Q&A sheet and Crossword!

 Harry O'Sullivan

 Denise Raward

 Emma Duffy

