New figures could turn that age old "rent or buy?" argument on its head.
CoreLogic have crunched the numbers and found that more than a third of properties across Australia (33.9%) had estimated mortgage repayments that were less than weekly rental payments.
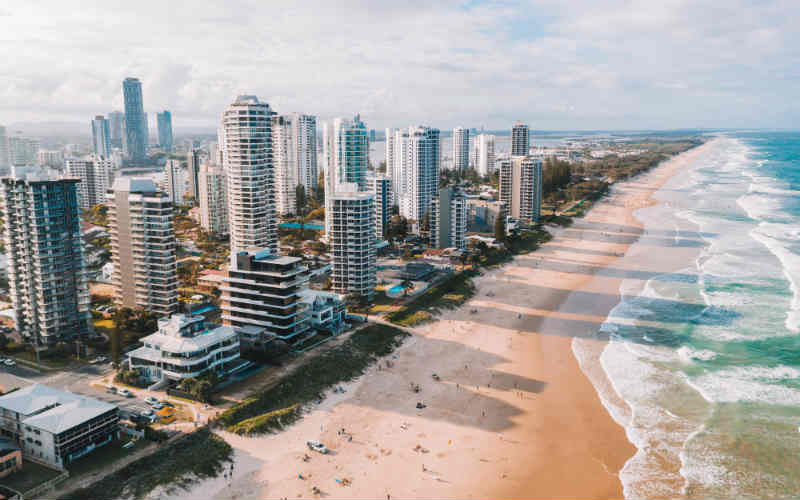
Most of these (20%) were in regional Queensland, particularly the Gold Coast and the Sunshine Coast.
In terms of capital cities, Darwin was the clear standout where 77.6% of properties had lower estimated mortgage repayments than rental costs.
According to Savings.com.au's research, the average monthly mortgage repayment for a house in Darwin is $1,800 (assuming the buyer has been able to save a 20% deposit for a house with a median price of $460,065 at a 3.23% p.a. interest rate). Compare that with the median weekly rent for a three-bedroom house in Darwin which is $1,952 per month.
Unsurprisingly, Sydney was the worst for mortgage affordability. Only 7.1% of properties had lower mortgage repayments than rental costs and most of these were located in areas where a unit glut has suppressed price growth.
The average monthly mortgage repayment for a house in Sydney would be $4,453 per month (assuming the buyer has been able to save a 20% deposit for a house with a median price of $1.14 million at a 3.23% p.a. interest rate). Comparatively, Sydney's average monthly rent is $2,120 per month according to Domain data.
CoreLogic Head of Research Eliza Owen said the varied dynamics across the cities could also have something to do with how property values have responded to recent rate cuts.
"The more property values increase in response to lower mortgage rates, the more the benefits of a low interest rate are eroded. In Sydney, a relatively high supply of rental stock has exacerbated the gap between mortgage repayments and rents," she said.
"Following a round of cash rate reductions from June 2019, Sydney dwelling values shot up 11.2% between June 2019 and January 2020, while Darwin dwellings fell 2.4% in the same period."
The data also shows the areas where rents increase faster than property values.
For example, rent value growth in Hobart was 5.8% in the year to January which outpaced dwelling market value growth of 5%.
"In some instances, relatively expensive rent payments can be a result of a highly transitory location - such as a mining location, university town or city CBDs. Rental markets can face more pressure because residents may prefer renting to owning," Ms Owen said.
"But another instance in which residents are dependent on the rental market is where they have no option to buy."
Saving for a deposit still a challenge
With housing affordability tipped to worsen, it's handy to know where it could work out cheaper to buy a home than to rent one.
But the data doesn't take into account the deposit hurdle, which remains a major challenge particularly for first home buyers.
On average, it takes millennials about five years to save for a house deposit according to an ING survey. The national average is 4.9 years for houses and 3.6 years for apartments.
However, the data does highlight low income areas where there's a high population of renters. For example, Auburn in Sydney (where rent is more expensive on 40% of properties) is one example of this.
"Some households may be better off owning than renting, but face greater challenges saving a deposit to buy because of a lower income level, and so greater demand is placed on the rental market," Ms Owen said.
"This could have implications for targeting policy around home ownership."

Ready, Set, Buy!
Learn everything you need to know about buying property – from choosing the right property and home loan, to the purchasing process, tips to save money and more!
With bonus Q&A sheet and Crossword!


 Bea Garcia
 Denise Raward
 Harry O'Sullivan
 Harrison Astbury
 Brooke Cooper

