This was largely buoyed by investor lending growth, up 5.3% annually - the strongest rate of growth since February 2016.
For owner occupiers, annual growth hit 9.1%, largely consistent with previous months' annualised growth in home loan debt.
Month-on-month growth across all home lending was 0.6%, largely consistent with how it's been over the past year.
Westpac economist Andrew Hanlan said it was stimulus and low interest rates driving the strong growth in debt.
"Looking ahead, housing credit growth is set to cool with an imminent RBA tightening cycle, likely beginning with a rate rise at the May meeting," Mr Hanlan said.
"There are tentative signs that a cooling of the owner-occupier market is already unfolding, impacted by stretched
housing affordability after the rapid run-up in dwelling prices."
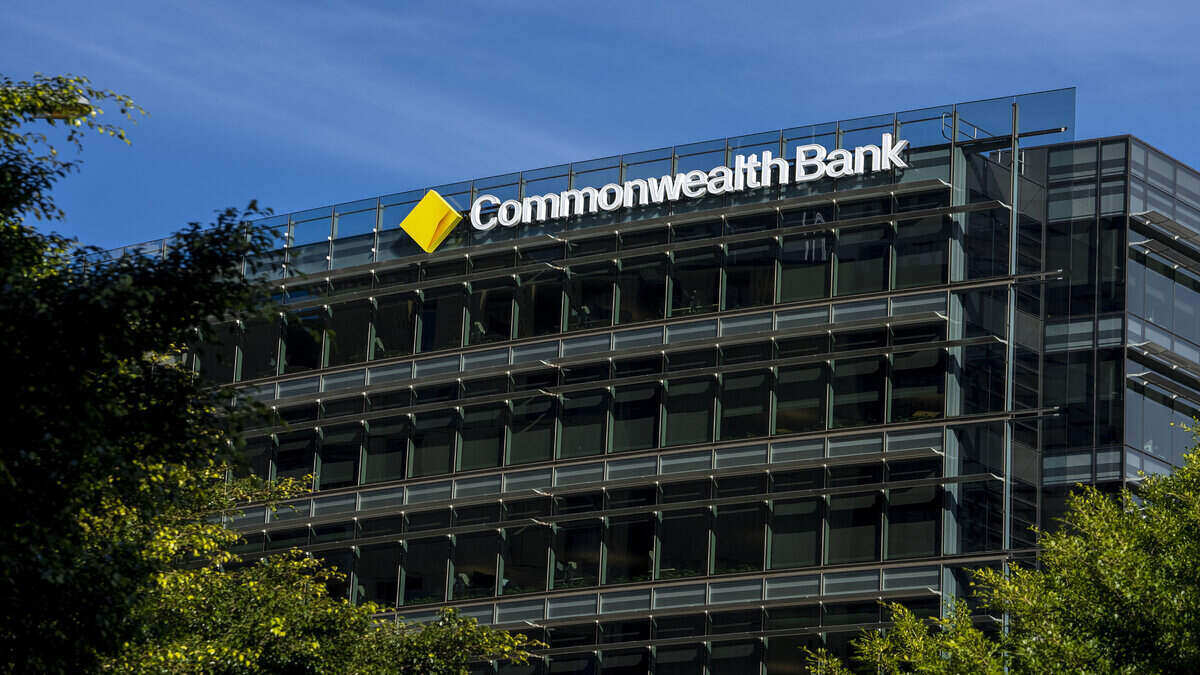
Despite the growth in home lending, over March ANZ lost approximately $224 million in owner occupier mortgages, according to prudential regulator data.
Investor lending, however, grew by approximately $142 million.
This result was weaker compared to its big four bank compatriots:
- CBA added approximately $1.38 billion in owner occupier loans; investors up $638 million.
- NAB up $1.27 billion, and $534 million.
- WBC up $581 million, and down $106 million.
ANZ's mortgage churn is well-documented, where at one stage in 2021 it was losing $1 billion in mortgage customers per month.
This was reportedly due to lagging home loan approval times, especially through brokers, with the onboarding of new customers outpaced by existing customers refinancing away.
Rate hikes to hit lending volume, house prices
The growth in home loan debt could change if the RBA starts increasing its cash rate target in either May or June, according to Westpac economists.
The major bank forecasts the cash rate to sit at 1.5% by the end of 2022 - 140 basis points higher than it is now.
"Both higher [consumer] prices and higher interest rates will be a significant squeeze on household incomes," Westpac economists said.
Westpac predicts dwelling prices will fall 2% over the 2022 calendar year, followed by an 8% fall in 2023 and 1% in 2024.
Domain's quarterly house price report also shows housing values declined in Melbourne and Canberra 0.9% and 0.7% respectively, while Sydney plateaued - up 0.2%.
Brisbane and Adelaide continued to steam ahead, up 3.1% and 3.0% over the quarter respectively.
ABS' lending data for February shows a decline in lending value, however, with owner occupier lending down 4.7% over the month and investor lending down 1.8% to $21.53 and $10.75 billion respectively.
Annually owner occupier lending was down 1.0% while investment lending was up 55.8%.
Advertisement
Buying a home or looking to refinance? The table below features home loans with some of the lowest interest rates on the market for owner occupiers.
| Lender | Home Loan | Interest Rate | Comparison Rate* | Monthly Repayment | Repayment type | Rate Type | Offset | Redraw | Ongoing Fees | Upfront Fees | Max LVR | Lump Sum Repayment | Extra Repayments | Split Loan Option | Tags | Features | Link | Compare | Promoted Product | Disclosure |
|---|---|---|---|---|---|---|---|---|---|---|---|---|---|---|---|---|---|---|---|---|
5.54% p.a. | 5.58% p.a. | $2,852 | Principal & Interest | Variable | $0 | $530 | 90% |
| Promoted | Disclosure | ||||||||||
5.49% p.a. | 5.40% p.a. | $2,836 | Principal & Interest | Variable | $0 | $0 | 80% |
| Promoted | Disclosure | ||||||||||
5.64% p.a. | 5.89% p.a. | $2,883 | Principal & Interest | Variable | $250 | $250 | 60% |
| Promoted | Disclosure | ||||||||||
5.64% p.a. | 5.89% p.a. | $2,883 | Principal & Interest | Variable | $248 | $350 | 60% |
| Disclosure |
Photo by Little John on Unsplash

Ready, Set, Buy!
Learn everything you need to know about buying property – from choosing the right property and home loan, to the purchasing process, tips to save money and more!
With bonus Q&A sheet and Crossword!


.jpg)

 Denise Raward
 Harry O'Sullivan

 Brooke Cooper
 Dominic Beattie

