
ANZ CoreLogic Housing Affordability Report revealed the time needed to amass a 20% deposit for a median-priced Australian home of $752,000 increased 6% nationally in the June 2022 quarter.
This increase takes the time needed to save a deposit nationally to a series high, almost double the 6.7 years needed to save a deposit back in 2002.
A report published earlier this year from Domain revealed Sydney held the title as the market requiring the longest period to save a 20% deposit for an entry-priced home, at eight years and one month.
Across the combined capital city markets, the report revealed the time it takes to save a deposit saw a marginal fall from 11.14 to 11.11 years - the equivalent of 11 days.
In comparison, the combined regional markets increased from 10.4 years to 10.7 years, some five months less than their capital city counterparts.
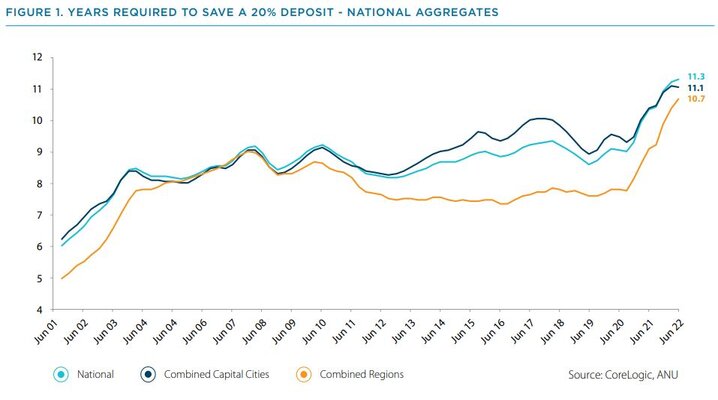
Source: ANZ CoreLogic Housing Affordability Report - September 2022
Greater Sydney regions of Manly, Pittwater and Warringah took out the top three in terms of the greatest reduction in years to save a 20% deposit, falling -2.5%, -2.5% and -2.1% respectively.
This comes as Sydney markets continue to turn, with CoreLogic's Daily Home Value Index revealing Sydney property prices have declined -5.9% in the June quarter.
Further, the report noted 15 of the 20 regions still have a higher deposit hurdle than at the onset of COVID-19 in March 2020.
CoreLogic’s Head of Australian Research Eliza Owen said higher living costs mean prospective buyers, including renters, may not be able to divert as much money to a deposit.
“Renters in particular are facing persistent challenges in attaining affordable and secure housing as rents increased by 9.8% nationally over the past year, the fastest rate on record,” Ms Owen said.
More income required to service a mortgage than ever before
The report revealed that as of the June quarter, the proportion of income required to service a new mortgage nationally increased to 44% in June, marking the highest level since June 2011.
Across the capital cities in the June quarter, mortgage serviceability deteriorated most where property values have continued to rise, being Brisbane and Adelaide.
In Brisbane, mortgage serviceability increased 4.5% from 37.3% to 41.8%, while in Adelaide serviceability increased 5.2% from 37.4% to 42.6%.
Markets are anticipating the cash rate to hit 2.50% by year's end; some economists now forecasting even higher, which in turn will mean variable mortgage rates will be dragged up too.
An increase in mortgage serviceability may potentially prompt a rise of mortgage prisoners when the time comes to refinance mortgage rates.
Speaking to Savings.com.au recently, Unloan CEO Daniel Oertli said higher serviceability requirements mean the new assessment (when refinancing) is done at a higher rate plus the buffer, not just the advertised interest rate.
“This is particularly the case in a rising rate environment where you obviously have qualified previously with the buffer in place, but now that rates are up again, even though you’d be better off financially, you can’t necessarily qualify at the current rate plus the buffer," Mr Oertli said.
Affordability for tenants continues to decline
The report revealed at the median household income level, 30.9% of income would be required to pay median rent on a new lease, up from 30.3% in the March quarter.
Further, CoreLogic's Hedonic Rent Index to July 2022 saw rents increase 9.8% nationally over the past year, marking the fastest rate on record.
This upward trend is marred by the imbalance of demand and supply across both sales and rental markets.
PRD Chief Economist Dr Diaswati Mardiasmo recently told Savings.com.au demand and supply imbalance is prominent, proving to be the crux of price movement.
“In the past 12 months to July 2022, we have seen this imbalance deepen, with demand outweighing supply, both in sales and rental markets,” Dr Mardiasmo said.
“Many more events and disruptions will colour the rest of 2022 and 2023, creating a never-ending seesaw of demand and supply balance in the Australian property market.”
ANZ and CoreLogic anticipate rental affordability will continue to show further deterioration in the September quarter, prompting more market competition for rental and a re-adjustment of the average number of people per household.
Advertisement
Buying a home or looking to refinance? The table below features home loans with some of the lowest interest rates on the market for owner occupiers.
| Lender | Home Loan | Interest Rate | Comparison Rate* | Monthly Repayment | Repayment type | Rate Type | Offset | Redraw | Ongoing Fees | Upfront Fees | Max LVR | Lump Sum Repayment | Extra Repayments | Split Loan Option | Tags | Features | Link | Compare | Promoted Product | Disclosure |
|---|---|---|---|---|---|---|---|---|---|---|---|---|---|---|---|---|---|---|---|---|
5.54% p.a. | 5.58% p.a. | $2,852 | Principal & Interest | Variable | $0 | $530 | 90% |
| Promoted | Disclosure | ||||||||||
5.49% p.a. | 5.40% p.a. | $2,836 | Principal & Interest | Variable | $0 | $0 | 80% |
| Promoted | Disclosure | ||||||||||
5.64% p.a. | 5.89% p.a. | $2,883 | Principal & Interest | Variable | $250 | $250 | 60% |
| Promoted | Disclosure | ||||||||||
5.64% p.a. | 5.89% p.a. | $2,883 | Principal & Interest | Variable | $248 | $350 | 60% |
| Disclosure |


")

Image by Chuttersnap via Unsplash

Ready, Set, Buy!
Learn everything you need to know about buying property – from choosing the right property and home loan, to the purchasing process, tips to save money and more!
With bonus Q&A sheet and Crossword!


 Bea Garcia
 Denise Raward
 Harry O'Sullivan
 Alex Brewster
 Rachel Horan