In Westpac’s Housing Pulse report for November 2022, Westpac economists said the national housing market remains in the grip of a correction phase which is expected to continue over the next few years.
Nationally, house prices have fallen by 6.6% from their peak in April following the RBA’s most rapid tightening cycle in more than 25 years according to CoreLogic data.
Noting the housing market is "hostage to the tightening cycle", Westpac economists said the course of the correction will be determined on two factors: how the inflation outlook evolves; and how heavily interest rate rises impact the wider economy.
“Australia’s housing market correction is now into its seventh month with interest rate rises remaining the dominant driver,” the report read.
“A steep 2.75 percentage point increase in standard variable mortgage rates since April has sharply curtailed borrowing power for new buyers.
“While there are some tentative signs that the pace of price declines may be moderating, we are unlikely to see a stabilisation any time soon.”
According to the report, past history shows there are three distinct phases to housing corrections.
The first is an initial decline in house prices as rate rises begin to bite - which is what the market is seeing currently.
This is followed by a further fall as continued high rates combine with a weakening economy, and then lastly a recovery phase is experienced as rate cuts combine with an economic turnaround.
With the RBA expected to continue increasing the cash rate and inflation constraints, Westpac economists believe the housing correction will enter phase two in 2023 before a recovery in 2024.
Read More: Will house prices really drop by 20% in 2023? Here’s what the experts predict
Which states will lead the way in the housing market decline?
Westpac economists said housing corrections are more advanced in NSW and Victoria, while WA and SA continue to hold up, albeit seeing momentum stall and sentiment decline.
In Sydney, house prices are reversing more quickly in the Eastern suburbs, Northern Beaches, and North Sydney, all of which outperformed during the boom.
In Victoria, Melbourne’s North East and Outer East are leading the declines along with the Mornington Peninsula and Geelong in regional areas.
The Victoria Consumer Housing Sentiment Index points to further turnover falls heading into 2023.
Meanwhile, the WA housing market continues to outperform most with prices only recording slight declines to date.
While the report noted weakness ahead, a tight supply-demand balance and firm backdrop for the state economy will provide clear support.
Advertisement
Buying a home or looking to refinance? The table below features home loans with some of the lowest interest rates on the market for owner occupiers.
| Lender | Home Loan | Interest Rate | Comparison Rate* | Monthly Repayment | Repayment type | Rate Type | Offset | Redraw | Ongoing Fees | Upfront Fees | Max LVR | Lump Sum Repayment | Extra Repayments | Split Loan Option | Tags | Features | Link | Compare | Promoted Product | Disclosure |
|---|---|---|---|---|---|---|---|---|---|---|---|---|---|---|---|---|---|---|---|---|
5.54% p.a. | 5.58% p.a. | $2,852 | Principal & Interest | Variable | $0 | $530 | 90% |
| Promoted | Disclosure | ||||||||||
5.49% p.a. | 5.40% p.a. | $2,836 | Principal & Interest | Variable | $0 | $0 | 80% |
| Promoted | Disclosure | ||||||||||
5.64% p.a. | 5.89% p.a. | $2,883 | Principal & Interest | Variable | $250 | $250 | 60% |
| Promoted | Disclosure | ||||||||||
5.64% p.a. | 5.89% p.a. | $2,883 | Principal & Interest | Variable | $248 | $350 | 60% |
| Disclosure |
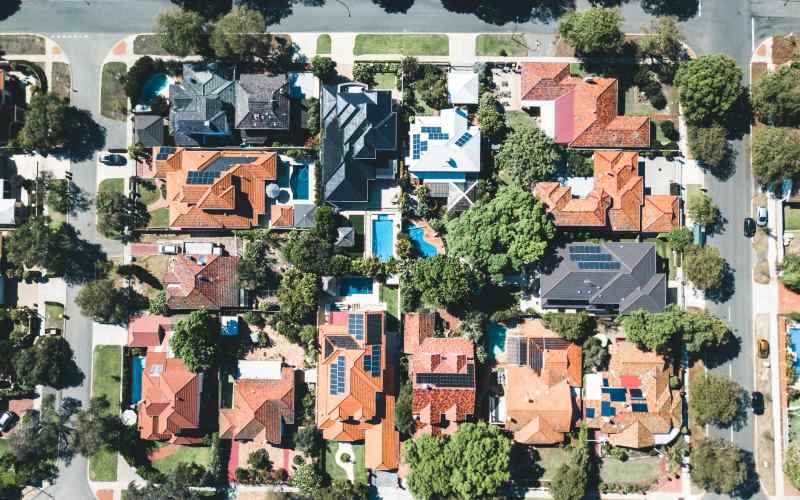
Image by Sheldon Kennedy via Unsplash

Ready, Set, Buy!
Learn everything you need to know about buying property – from choosing the right property and home loan, to the purchasing process, tips to save money and more!
With bonus Q&A sheet and Crossword!


 Harrison Astbury
 Arjun Paliwal


