CoreLogic’s national Home Value Index found prices fell in every capital city and nearly every region as well as the RBA’s recent cash rate hikes begin to bite.
The median national home price now sits at $721,018.
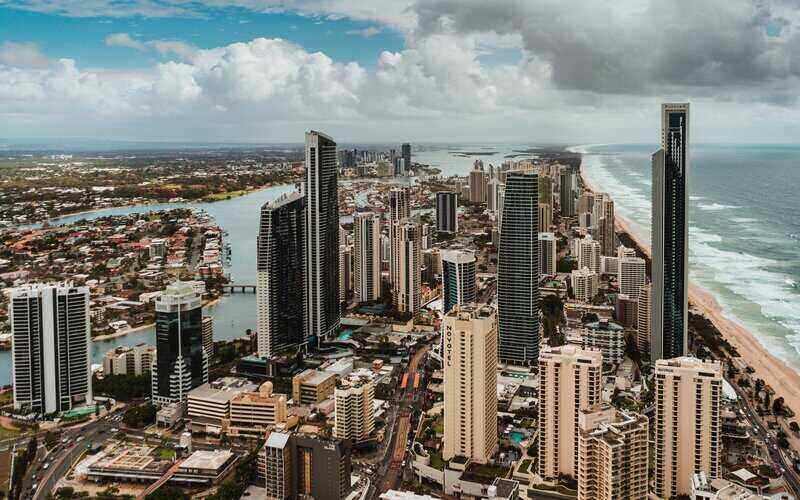
Brisbane house prices slumped by 2% in October, the largest monthly decline recorded for the capital city.
However, the Sunshine State is far behind the housing value downturn felt by other markets.
Since peaking in January, Sydney’s house prices have fallen 10.2% while Melbourne’s dropped by 6.4% since hitting their peak in February.
Meanwhile, Brisbane house prices have dropped by 6.2% since peaking in June.
Across the rest-of-state regions, monthly falls of more than 1% were recorded in regional NSW, -1.7%; regional Victoria, -1.4%; and regional Queensland, -1.3%.
Regional South Australia was the only area to register an uptick in housing values by 0.1%.
| Month | Annual | Median Value | |
| Sydney | -1.3% | -8.6% | $1,036,727 |
| Melbourne | -0.8% | -5.6% | $767,117 |
| Brisbane | -2.0% | 8.4% | $728,615 |
| Adelaide | -0.3% | 16.5% | $654,079 |
| Perth | -0.2% | 4.0% | $559,043 |
| Hobart | -1.1% | -1.0% | $696,334 |
| Darwin | -0.8% | 4.9% | $507,081 |
| Canberra | -1.0% | 1.0% | $876,567 |
| Combined capitals | -1.1% | -3.1% | $787,485 |
| Combined regional | -1.4% | 6.6% | $581,412 |
| National | -1.2% | -0.9% | $721,018 |
Source: CoreLogic Index results as at 31 October, 2022
CoreLogic Research Director Tim Lawless said the double whammy of rising inflation and further cash rate hikes could see housing values decline even further.
“There is a genuine risk we could see the rate of decline re-accelerate as interest rates rise further and household balance sheets become more thinly stretched,” Mr Lawless said.
“To-date, the housing downturn has remained orderly, at least in the context of the significant upswing in values. This is supported by a below-average flow of new listings that is keeping overall inventory levels contained.
“We do know that there’s going to be a lot of people moving out of their fixed rate mortgages through early next year, so potentially, there could be a situation where we do start to see some evidence of distress in the marketplace.”
Despite the declines, housing values across most of the broad regions remain well above pre-COVID levels.
Does the PropTrack Home Price Index tell the same story?
According to the REA Group’s PropTrack report, home prices fell by a modest 0.06% in October, the smallest fall since national home prices peaked in March 2022.
In the capital cities, prices fell 0.11% while regional areas experienced a 0.06% increase.
Home prices in Melbourne stalled in October (0.02%) while Darwin recorded the strongest growth out of the capital cities with a 0.21% upswing.
Meanwhile, Sydney saw prices down by 0.21% to sit 5.82% below their level a year ago.
Brisbane recorded the lowest decline in the month at 0.09%.
“Rising interest rates have quickly rebalanced the housing market from last year’s extreme growth,” said Eleanor Creagh, PropTrack Senior Economist.
“However, the pace of price falls has slowed from the faster falls seen earlier this year when interest rates first started rising.”
See Also: When will the house price plunge hit?
Advertisement
Buying a home or looking to refinance? The table below features home loans with some of the lowest interest rates on the market for owner occupiers.
| Lender | Home Loan | Interest Rate | Comparison Rate* | Monthly Repayment | Repayment type | Rate Type | Offset | Redraw | Ongoing Fees | Upfront Fees | Max LVR | Lump Sum Repayment | Extra Repayments | Split Loan Option | Tags | Features | Link | Compare | Promoted Product | Disclosure |
|---|---|---|---|---|---|---|---|---|---|---|---|---|---|---|---|---|---|---|---|---|
5.54% p.a. | 5.58% p.a. | $2,852 | Principal & Interest | Variable | $0 | $530 | 90% |
| Promoted | Disclosure | ||||||||||
5.49% p.a. | 5.40% p.a. | $2,836 | Principal & Interest | Variable | $0 | $0 | 80% |
| Promoted | Disclosure | ||||||||||
5.64% p.a. | 5.89% p.a. | $2,883 | Principal & Interest | Variable | $250 | $250 | 60% |
| Promoted | Disclosure | ||||||||||
5.64% p.a. | 5.89% p.a. | $2,883 | Principal & Interest | Variable | $248 | $350 | 60% |
| Disclosure |


")

Image by Angie via Pexels

Ready, Set, Buy!
Learn everything you need to know about buying property – from choosing the right property and home loan, to the purchasing process, tips to save money and more!
With bonus Q&A sheet and Crossword!


 Emma Duffy
 Brooke Cooper