New figures from CoreLogic could turn the age old "rent or buy?" argument on its head.
The number of suburbs where it’s cheaper to buy than rent has been slashed in the past year, due to consecutive rate hikes and soaring monthly mortgage repayments.
The analysis found nine in 10 suburbs across the nation (90%) had estimated weekly rental payments that were less than mortgage repayments.
Out of the 3,904 house and unit markets, only 9.1% of suburbs were cheaper to buy than rent for houses, down from 30.2% of suburbs this time last year.
For units, just 16% of suburbs are cheaper to buy in than rent, down 45.2%.
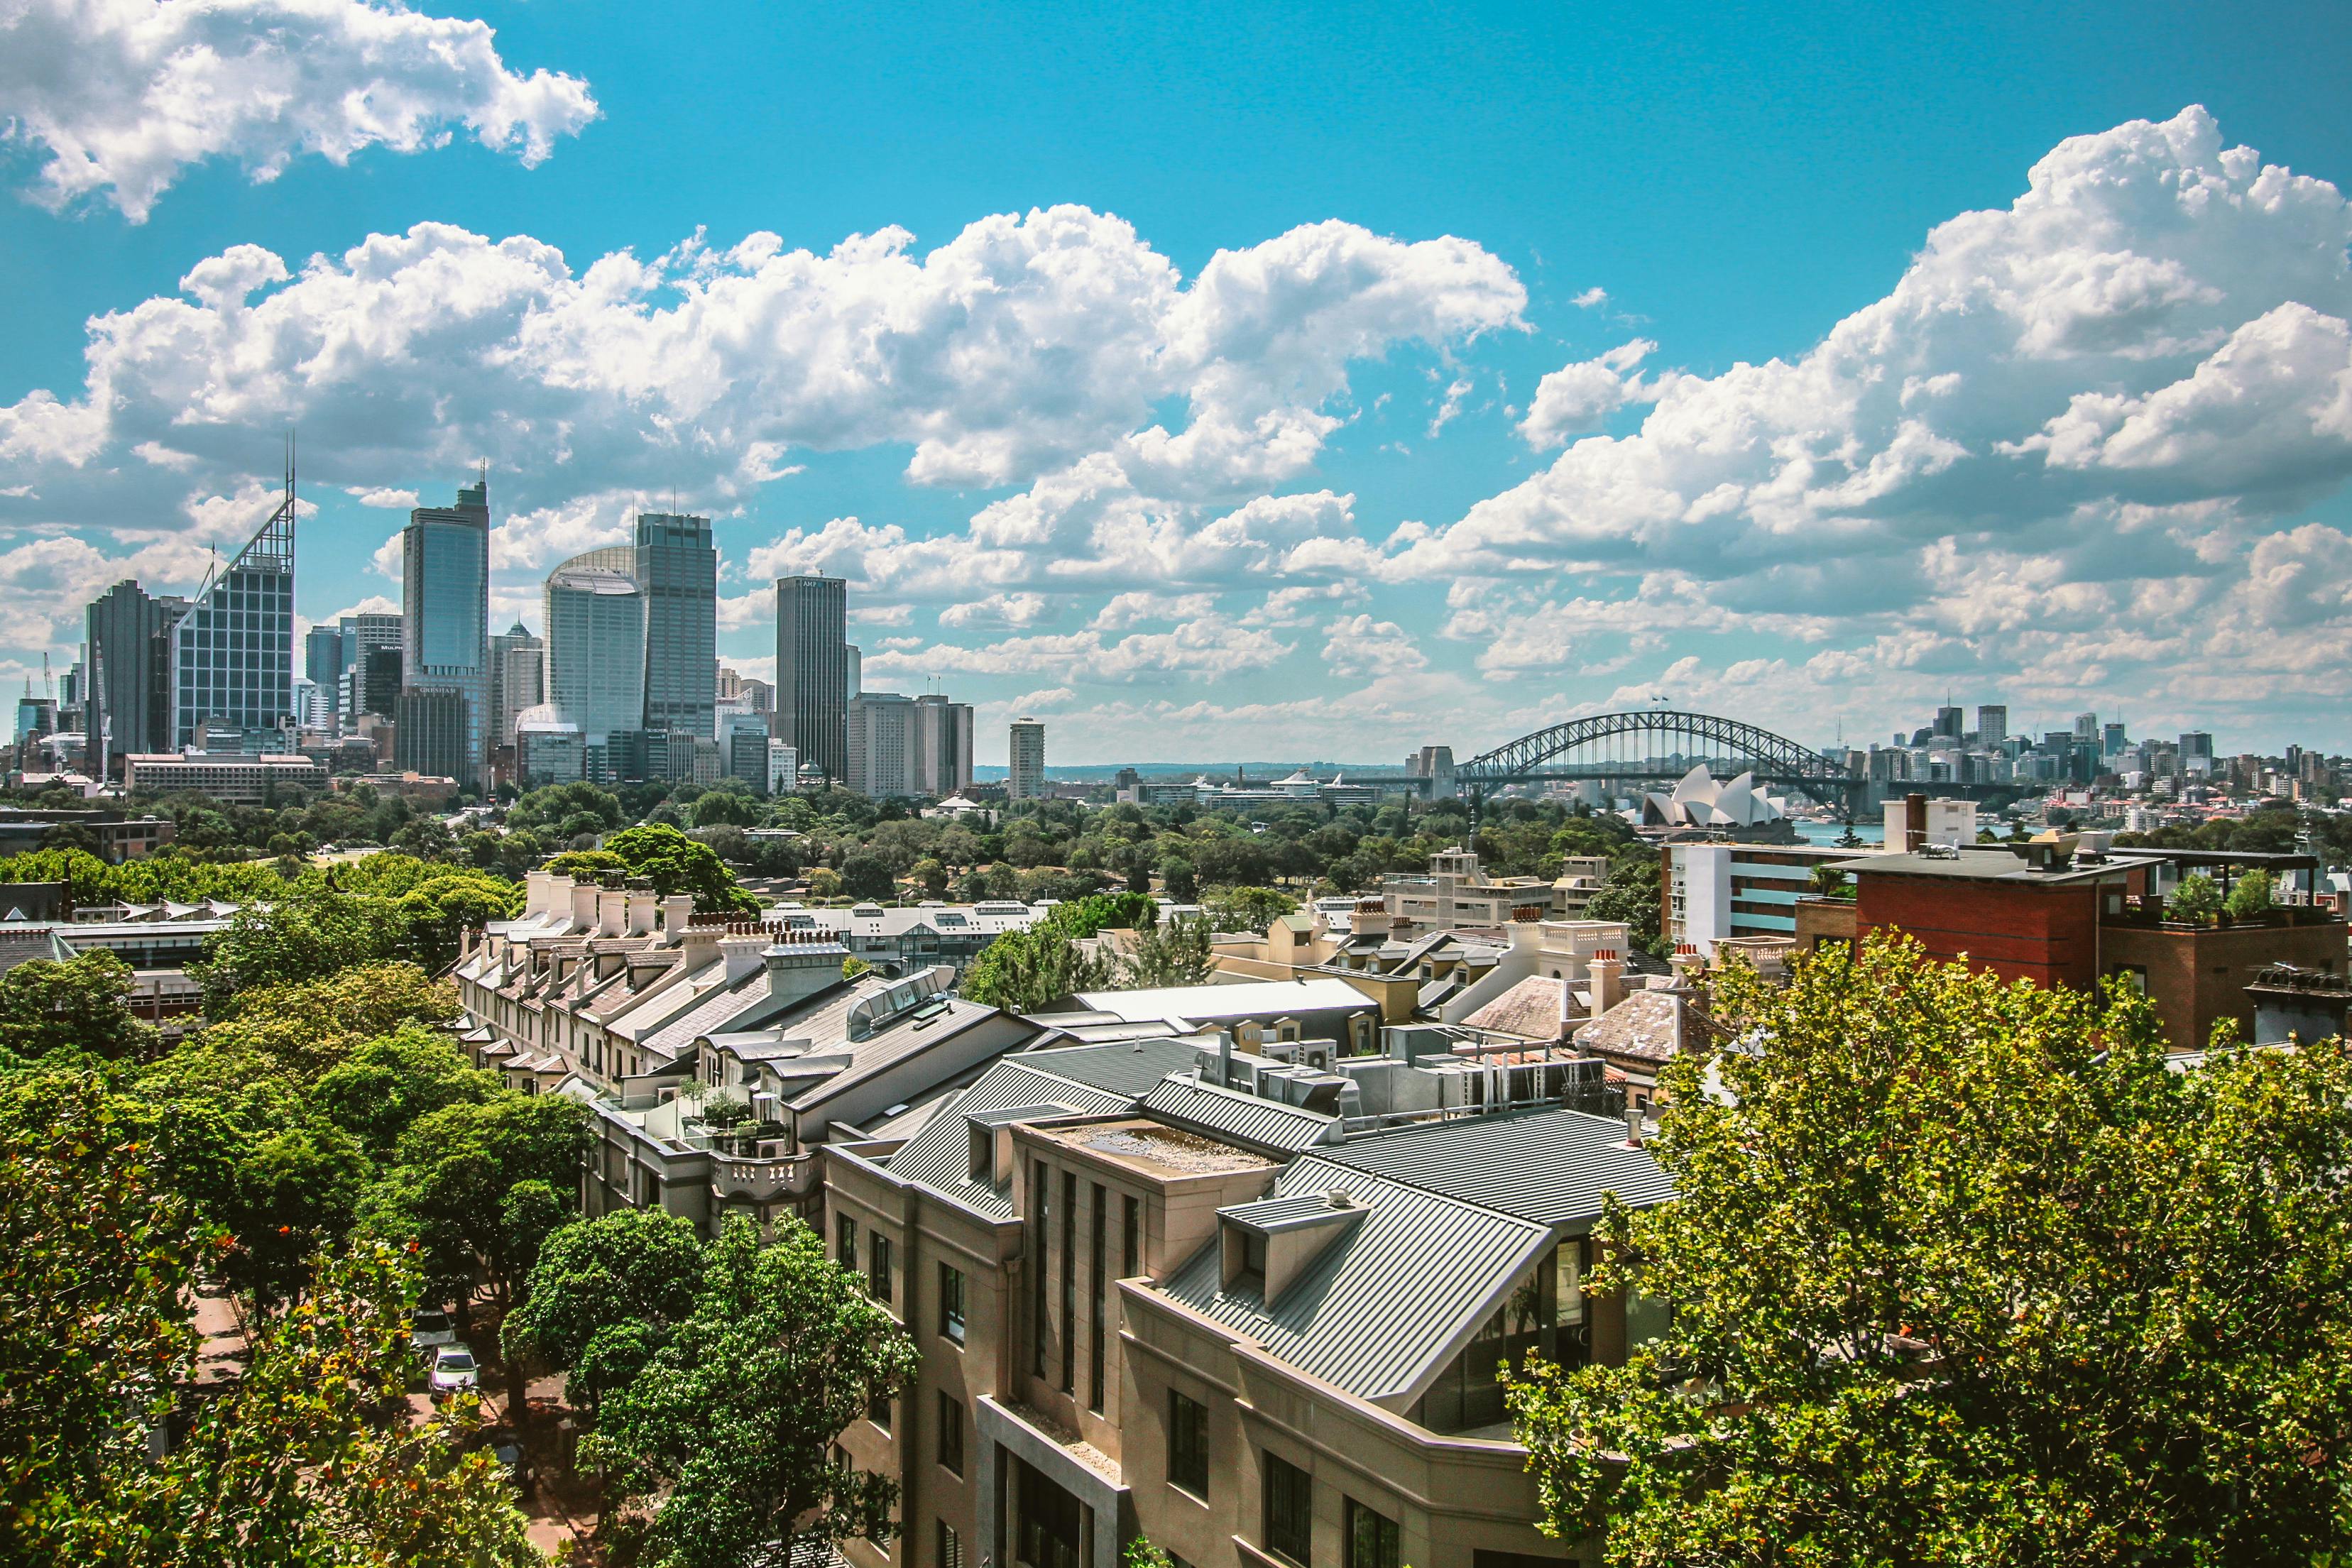
Houses are cheaper to rent than buy in every suburb in the Canberra (ACT), Melbourne, and Sydney.
Meanwhile, 100% of suburbs in Hobart, Sydney, regional South Australia and regional Tasmania were cheaper to rent a unit than buy in February 2023.
CoreLogic Research Director Tim Lawless said renting has become the more affordable option across the country as homeowners battle rising costs, but this may offer little respite to both cohorts doing it tough.
“Despite a double-digit surge in rents nationally, exacerbated by a shortage of rental properties, record levels of net overseas migration and more people returning to major cities for work and studies, the proportion of suburbs where it’s cheaper to rent than buy has increased exponentially in the past year,” Mr Lawless said.
“There is no doubt the cost to service a mortgage compared to rent is keeping people in rental accommodation, adding to the extreme pressure on rental demand at a time when supply levels have not responded.
“While many tenants might see home ownership as a way of breaking out of the rent cycle, it’s just not possible for many because the cost to service a mortgage has become even more onerous in the past year with the increase in repayments outstripping the increase in rents by some margin.”
Nationally, rents have increased 10.1% over the past year, approximately adding $225 more to monthly repayments.
On the flipside, the 325 basis point jump in the cash rate by February 2023 has added roughly $774 per month to mortgage repayments.
Where it's cheaper to rent than buy
The suburbs where it’s far cheaper to rent than buy are skewed towards the premium end of the capital city markets where housing values tend to be extremely high.
All top five suburbs are located in Sydney’s exclusive Eastern suburbs.
| Top five suburbs where it's cheaper to rent than buy February 2023: CoreLogic | |||||
| Suburb name | Property type | Region | Median value | Monthly mortgage repayments | Monthly rental costs |
| Vaucluse | Houses | Greater Sydney | $7.79 million | $38,648 | $12,232 |
| Bellevue Hill | Houses | Greater Sydney | $7.14 million | $35,418 | $9,697 |
| Rose Bay | Houses | Greater Sydney | $5.61 million | $27,850 | $10,246 |
| Dover Heights | Houses | Greater Sydney | $5.21 million | $25,871 | $8,950 |
| Bronte | Houses | Greater Sydney | $4.48 million | $22,231 | $8,307 |
See Also: A state by state breakdown of the suburbs where rents have increased the most
Potential buyers still battling for properties as listings dry up
For those who aren’t deterred by rising interest rates, new PropTrack data has revealed the suburbs where homes have as many as 500 potential buyers locking horns for the purchase.
The most in demand suburbs nationally for houses include:
- Upper Sturt, Adelaide – 536 potential buyers per listing
- Kangaroo Ground, Melbourne – 484 potential buyers per listing
- Medindie, Adelaide – 477 potential buyers per listing
The most in demand suburbs nationally for units include:
- Bulli, Sydney - 214 potential buyers per listing
- West Pennant Hills, Sydney - 186 potential buyers per listing
- Croydon South, Melbourne - 184 potential buyers per listing
This could be due to the lack of listings available at the moment, which pushes demand up for the properties that are on the market.
CoreLogic is reporting that listing numbers are 9.1% below the five-year average over the past four-week reporting period, and total advertised listings are around 20% below their level for the average of this time of the year.
"Although the outlook for housing markets is looking increasingly buoyant, we remain cautious in calling a bottom in the cycle," CoreLogic research analyst Caitlin Fono said.
"There is still some catch up in the interest rates cycle before households see the full impact of higher rate and its likely economic conditions will slow through the rest of the year and labour markets will loosen.”
Advertisement
Buying a home or looking to refinance? The table below features home loans with some of the lowest interest rates on the market for owner occupiers.
| Lender | Home Loan | Interest Rate | Comparison Rate* | Monthly Repayment | Repayment type | Rate Type | Offset | Redraw | Ongoing Fees | Upfront Fees | Max LVR | Lump Sum Repayment | Extra Repayments | Split Loan Option | Tags | Features | Link | Compare | Promoted Product | Disclosure |
|---|---|---|---|---|---|---|---|---|---|---|---|---|---|---|---|---|---|---|---|---|
5.54% p.a. | 5.58% p.a. | $2,852 | Principal & Interest | Variable | $0 | $530 | 90% |
| Promoted | Disclosure | ||||||||||
5.49% p.a. | 5.40% p.a. | $2,836 | Principal & Interest | Variable | $0 | $0 | 80% |
| Promoted | Disclosure | ||||||||||
5.64% p.a. | 5.89% p.a. | $2,883 | Principal & Interest | Variable | $250 | $250 | 60% |
| Promoted | Disclosure | ||||||||||
5.64% p.a. | 5.89% p.a. | $2,883 | Principal & Interest | Variable | $248 | $350 | 60% |
| Disclosure |
Image by freepik

Ready, Set, Buy!
Learn everything you need to know about buying property – from choosing the right property and home loan, to the purchasing process, tips to save money and more!
With bonus Q&A sheet and Crossword!


 Bea Garcia
 Denise Raward
 Harry O'Sullivan
 Emma Duffy
 Arjun Paliwal

