
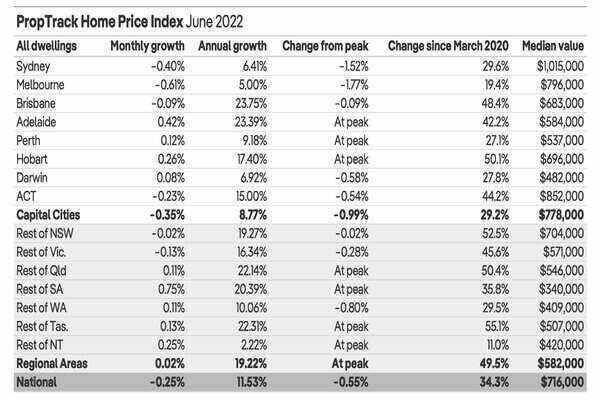
According to the PropTrack Home Price Index, home prices fell nationally in June by 0.25% although prices are still up by 34% since March 2020.
Sydney and Melbourne were the two cities with the leading price decreases of 0.4% and 0.6% respectively.
In Sydney, property prices are now 1.5% below the peak seen in February 2022 with annual price growth at the slowest rate seen since October 2020.
Melbourne property prices fell for the fourth consecutive month in June with prices now 1% below the peak in February 2022.
Australia’s third largest capital city, Brisbane, experienced its first fall in property values since April 2020 with a decline of 0.09%.
Despite this, data shows Brisbane is still the strongest market over the past year and will continue to outperform other markets in the near future.
PropTrack economist Paul Ryan said the two-speed housing market remains evident in the country.
“Hobart and Adelaide were the strongest performing capitals over the month, both reaching new price peaks,” Mr Ryan said.
“The biggest slowdowns have been in the most expensive markets of Sydney, Melbourne and the ACT.
“Affordable lifestyle regions of Brisbane, Adelaide, regional QLD and Tasmania have continued to grow, but the slowdown is spreading to these markets, with Brisbane posting its first small fall since the pandemic began.”
CoreLogic data reveals a different truth to property values
A rival report by CoreLogic’s Home Value Index found that housing prices fell across the country by 0.6% in June with Sydney (-1.6%) and Melbourne (-1.1%) leading the charge.
According to the data released, five capital cities recorded an increase in property values: Adelaide with 1.3%; Darwin, 0.9%; Perth, 0.4%; Canberra, 0.3%; and Brisbane, 0.1%.
Tim Lawless, CoreLogic Research Director, said rising interest rates and inflation were the main causes for falling property prices.
“Housing value growth has been easing since moving through a peak in March last year, when early drivers of the slowdown included rising fixed term mortgage rates, an expiry of fiscal support, a trend towards lower consumer sentiment, affordability challenges and tighter credit conditions,” Mr Lawless said.
“More recently, surging inflation and a rapidly rising cash rate have added further momentum to the downwards trend.
“Considering inflation is likely to remain stubbornly high for some time, and interest rates are expected to rise substantially in response, it’s likely the rate of decline in housing values will continue to gather steam and become more widespread.”
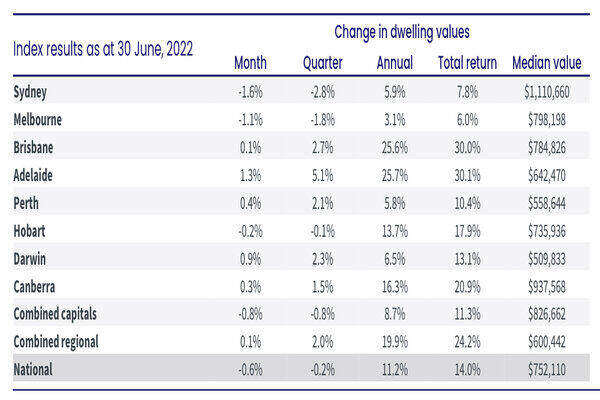
Source: CoreLogic Home Value Index
Although home sales nationally through the June quarter were -15.9% lower than a year ago, they are still holding 13% above the previous five year figure.
The future of housing values is in the hands of interest rates
The trajectory of property prices all depends on interest rates. According to Mr Lawless, it is possible the cash rate could increase beyond the pre-COVID 10 year average of 2.56%.
“Under this scenario, the average variable mortgage rate for new owner occupier loans would be approximately 4.96%, more than double the rates in April, adding roughly $720 per month to a $500,000 mortgage,” he said.
“The double whammy of high inflation is another factor likely to weigh on the household sector and ultimately housing demand.”
However, the future of housing values remains uncertain.
The CoreLogic report suggests a peak to trough decline of more than 10% is becoming more mainstream across the various private sector forecasts.
Rents rise across the country
CoreLogic data also revealed rents increased across the country by 0.9% in June.
“Such strong rental conditions through the current cycle have occurred largely in the absence of overseas migration, although the reopening of international borders is likely adding further upwards pressure on rental demand," Mr Lawless explained.
"A reduction in average household size through the pandemic helps to explain such high rental demand during a time of closed international borders."
With rental markets expected to remain tight, it is more than likely rent will continue to outrun growth in housing values.
See Also: Declining property prices not enough to offset rising interest rates
Advertisement
Buying a home or looking to refinance? The table below features home loans with some of the lowest interest rates on the market for owner occupiers.
Lender Home Loan Interest Rate Comparison Rate* Monthly Repayment Repayment type Rate Type Offset Redraw Ongoing Fees Upfront Fees Max LVR Lump Sum Repayment Extra Repayments Split Loan Option Tags Features Link Compare Promoted Product Disclosure
Promoted
Disclosure
Promoted
Disclosure
Promoted
Disclosure
Disclosure


")

Image by Belle Co via Pexels

Ready, Set, Buy!
Learn everything you need to know about buying property – from choosing the right property and home loan, to the purchasing process, tips to save money and more!
With bonus Q&A sheet and Crossword!


 Bea Garcia
 Denise Raward
 Harry O'Sullivan
 Harrison Astbury