Australia's median house value across the capital cities hit the $1 million mark in August last year, smashing the perception that Sydney was the country's only millionaire hotspot.
Now new research from Cotality (formerly CoreLogic) shows over a third (34.4%) of homes nationally are valued at $1 million or higher.
That's up from 9.7% just 10 years ago.
It should come as no surprise given Australia's home values have increased more than 67% over the past decade.
Million dollar homes by city
Sydney continues to hold the mantle for the highest proportion of homes over $1 million, with almost two-thirds of the city's housing stock (64.4%) passing the threshold.
Ten years ago, $1 million would have seen buyers purchase a five-bedroom home.
Now the median price for a three-bedder is $1.3 million and it will be situated considerably further afield.
The next highest proportion of million dollar homes might come as a surprise to some but Brisbane now has more than 40% of its housing stock over the $1 million mark.
That's up from just 2.8% a decade ago - the sharpest increase of anywhere in Australia.
With Brisbane's median house value currently at $990,000, it's expected to pass the $1 million benchmark this year.
In third place is Melbourne where 30.9% of homes were valued at $1 million or more in April.
It's down from 33.1% in three years, just before Australia's steep hike in the cash rate.
Still, the the figure is up from 12.4% of homes being valued at $1 million or more a decade ago.
Strong growth in the 'mid-sized' capitals
Adelaide and Perth are following a similar trajectory to Brisbane, with strong value growth since the pandemic seeing sharp increases in $1 million-plus homes.
Currently, 27.8% of Adelaide homes are over the $1 million mark, up from 4.2% in March 2020.
Over the same period, just over a quarter of Perth's homes are now $1 million or more, up from 6%.
Among the capitals, Hobart is the outlier, seeing a reversal of million-dollar home status as the city's property values have fallen.
Currently, 11.9% of Hobart's homes are valued at $1 million or more, down from 20.3% in just over three years.
Finally, Darwin has the lowest proportion of million-dollar homes at just 1.3%.
This is fairly consistent with the figure a decade ago when 1% of homes were valued over $1 million.
What do the figures show?
As with most things, there are upsides and downsides.
Cotality's head of research Eliza Owen points out Australia's million-dollar housing markets are, in part, a reflection of our wealth and prosperity as a nation.
"Housing markets wouldn't have a million-dollar price tag if at least some Australians couldn't come up with that level of finance," she said.
However, she said the downsides of such an extraordinary price point are becoming increasingly evident.
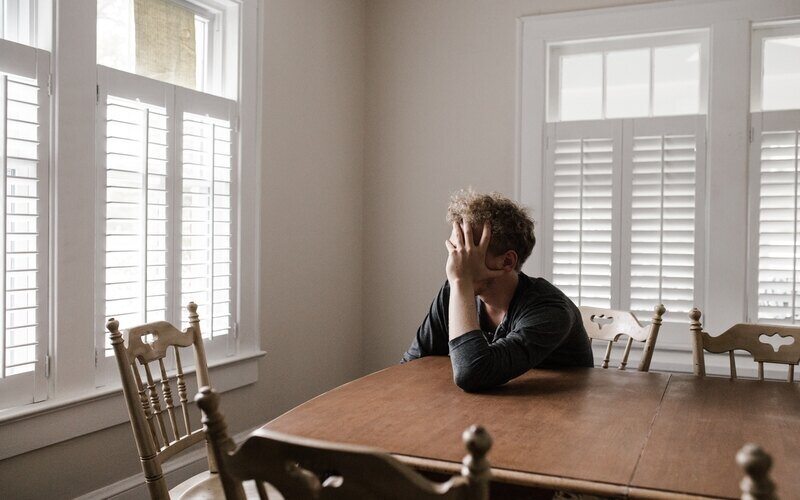
"The rate of home ownership has gradually declined over time, particularly among younger, low-income households where income cannot keep pace with growth," Ms Owen said.
Home ownership increasingly out of reach
The average age of first homebuyers has increased while increasingly wealthy households are renting for longer while they attempt to save deposits.
See also: How to save up for a house deposit
In turn, this has increased competition for low income households on the rental market, Ms Owen said.
"Housing debt has also blown out to keep pace with rising values relative to more subdued wages growth," she said.
The Reserve Bank of Australia recorded housing debt relative to income at 135% at the end of 2024.
This was up from 122% a decade before.
"With [home] values expected to continue rising on the back of [interest] rate falls in 2025, the wealth divide between home owners and non-home owners is also likely to expand," Ms Owen said.
Advertisement
Buying a home or looking to refinance? The table below features home loans with some of the lowest interest rates on the market for owner occupiers.
| Lender | Home Loan | Interest Rate | Comparison Rate* | Monthly Repayment | Repayment type | Rate Type | Offset | Redraw | Ongoing Fees | Upfront Fees | Max LVR | Lump Sum Repayment | Extra Repayments | Split Loan Option | Tags | Features | Link | Compare | Promoted Product | Disclosure |
|---|---|---|---|---|---|---|---|---|---|---|---|---|---|---|---|---|---|---|---|---|
5.54% p.a. | 5.58% p.a. | $2,852 | Principal & Interest | Variable | $0 | $530 | 90% |
| Promoted | Disclosure | ||||||||||
5.49% p.a. | 5.40% p.a. | $2,836 | Principal & Interest | Variable | $0 | $0 | 80% |
| Promoted | Disclosure | ||||||||||
5.64% p.a. | 5.89% p.a. | $2,883 | Principal & Interest | Variable | $250 | $250 | 60% |
| Promoted | Disclosure | ||||||||||
5.64% p.a. | 5.89% p.a. | $2,883 | Principal & Interest | Variable | $248 | $350 | 60% |
| Disclosure |


")

Image by Ingo Joseph via Pexels

Ready, Set, Buy!
Learn everything you need to know about buying property – from choosing the right property and home loan, to the purchasing process, tips to save money and more!
With bonus Q&A sheet and Crossword!


 Harrison Astbury