High rental yields can increase an investor's chances of having a positively geared property. This means the property generates more income (i.e. rent) each year than it costs in interest payments and other expenses. According to the data, these suburbs are where you can expect to find the Australian properties with the highest rental yields at the moment.
How important are rental yields to property investors?
For investors, rental yield is a useful way to assess annual income, but there are plenty of other things to take into account as well, like vacancy rates, planned investment and other factors that could suggest strong capital gains.
Simon Pressley of Propertyology says basing property investments primarily on rental yields is a "flawed strategy".
"At the end of the day, a few thousand dollars of income per year is nowhere near enough to retire on," Mr Pressley told Savings.com.au.
"But a property that produces strong capital growth means hundreds of thousands of dollars' equity, enabling the investor to repeat the process, plus the option of converting equity into cash during the retirement years."
He said the most important consideration should be selecting an area with good economic fundamentals as this is what drives capital growth.
"The next most important priority is buying a conventional asset - a standard house - in a central part of town. When it comes to sell, the conventional nature will attract a larger resale audience than other assets," Mr Pressley said.
"Apartments produce higher rental yields than a conventional house in the same location, but our studies confirm that investing in asset types other than detached houses is surrendering half, or more, of your capital growth potential."
What gives a suburb a strong rental yield?
Rental yield is how much income a property generates relative to its value. It's calculated by dividing the annual rental income a property generates by its market value.
If the value of a property increases dramatically but the rental yield stays the same, the rental yield decreases. This doesn't mean the property is generating any less income, just that the income is smaller relative to the property value.
Rental yields tend to be higher in areas where the demand for rent is higher than the demand for owner-occupied property.
For example, in January 2025, six of the top ten suburbs by rental yield for houses were in rural Western Australia. If you've heard of areas like the Coolgardie or Pilbara regions, it was likely in relation to mining. Pilbara sits on top of one of the biggest iron ore deposits in the world, while towns like Kambalda in Coolgardie are also mining hotspots for minerals like gold and nickel.
Demand for property can therefore be more transient, as miners come and go. Other mining centres like Mount Isa in Queensland feature prominently in both lists.
The vast majority of the suburbs in the top 100 lists are outside of the capital cities of the respective states. In the list for houses there isn't a single suburb within the Statistical Division of any of the eight capital cities.
Perhaps unsurprisingly, the capitals fare a little better for units. There were 17 suburbs from Darwin, 12 from Perth, six from Melbourne, two from Brisbane and one each from Adelaide and Canberra - but that still leaves more than 50% of the top suburbs for rental yield outside of the major cities.
Australia rental yields in 2025
Rental yields increase when the cost of renting becomes greater relative to property values. Here's how we were sitting as of January 2025:
| State | Area | Property Type | Median Price | Weekly Median Advertised Rent | Gross Rental Yield |
|---|---|---|---|---|---|
| ACT | Metro | Houses | $937,500 | $650 | 3.6% |
| ACT | Metro | Units | $593,000 | $570 | 5.0% |
| NSW | Metro | Houses | $1,390,000 | $750 | 2.7% |
| NSW | Metro | Units | $790,000 | $700 | 4.6% |
| NT | Metro | Houses | $560,000 | $650 | 6.0% |
| NT | Metro | Units | $360,000 | $540 | 7.7% |
| QLD | Metro | Houses | $900,000 | $620 | 3.7% |
| QLD | Metro | Units | $659,728 | $600 | 5.0% |
| SA | Metro | Houses | $842,500 | $590 | 3.8% |
| SA | Metro | Units | $590,500 | $520 | 4.8% |
| TAS | Metro | Houses | $695,000 | $550 | 4.1% |
| TAS | Metro | Units | $548,750 | $475 | 4.7% |
| VIC | Metro | Houses | $830,000 | $575 | 3.5% |
| VIC | Metro | Units | $598,400 | $550 | 4.7% |
| WA | Metro | Houses | $780,000 | $650 | 4.5% |
| WA | Metro | Units | $550,000 | $620 | 6.2% |
| NSW | Country | Houses | $750,000 | $565 | 3.9% |
| NSW | Country | Units | $635,000 | $490 | 4.0% |
| NT | Country | Houses | $442,500 | $550 | 6.7% |
| NT | Country | Units | $275,000 | $420 | 7.7% |
| QLD | Country | Houses | $690,000 | $620 | 4.9% |
| QLD | Country | Units | $640,000 | $560 | 4.7% |
| SA | Country | Houses | $477,500 | $415 | 4.8% |
| SA | Country | Units | $390,000 | $300 | 4.8% |
| TAS | Country | Houses | $549,000 | $450 | 4.4% |
| TAS | Country | Units | $430,000 | $390 | 4.7% |
| VIC | Country | Houses | $550,000 | $475 | 4.5% |
| VIC | Country | Units | $415,000 | $395 | 4.9% |
| WA | Country | Houses | $535,000 | $620 | 6.6% |
| WA | Country | Units | $360,000 | $580 | 8.5% |
Source: CoreLogic. Data reported to the period ending January 2025. Median values account for sales transactions over three months.
After a record breaking period of rental growth, things appear to be easing up at the beginning of 2025. The Domain Rent Report for the March 2025 quarter found although rents remain at record highs, growth through the year was the slowest since 2021.
"Increasing supply is slowing price growth and while it's still not enough to fully meet demand we can see that it's helping to rebalance some of the tightest rental markets," Domain Head of Research Dr Nicola Powell said.
House price growth also slowed around the turn of the year, with a small downturn in the early months of 2025. As of March though, the CoreLogic Home Value Index had turned around, once again taking the national median dwelling price to all time highs.
The latest data on rental yields (up to January) suggests the highest rental yields in Australia are to be found in regional Western Australia and the Northern Territory. The average house in country NT has a rental yield of 6.7%, while investors could expect a 8.5% annual return on units in rural WA.
For cities, Darwin had the highest average yield for both houses (6.0%) and units (7.7%).
Read more:
Interested in an investment property? Here are some of the top options in Australia at the moment
| Lender | Home Loan | Interest Rate | Comparison Rate* | Monthly Repayment | Repayment type | Rate Type | Offset | Redraw | Ongoing Fees | Upfront Fees | Max LVR | Lump Sum Repayment | Extra Repayments | Split Loan Option | Tags | Features | Link | Compare | Promoted Product | Disclosure |
|---|---|---|---|---|---|---|---|---|---|---|---|---|---|---|---|---|---|---|---|---|
5.69% p.a. | 6.03% p.a. | $2,899 | Principal & Interest | Variable | $0 | $530 | 90% |
| Disclosure | |||||||||||
5.74% p.a. | 5.76% p.a. | $2,915 | Principal & Interest | Variable | $0 | $250 | 60% | Disclosure | ||||||||||||
5.69% p.a. | 5.60% p.a. | $2,899 | Principal & Interest | Variable | $0 | $0 | 80% |
| Promoted | Disclosure | ||||||||||
5.84% p.a. | 5.88% p.a. | $2,947 | Principal & Interest | Variable | $0 | $530 | 90% |
| Promoted | Disclosure | ||||||||||
5.74% p.a. | 5.76% p.a. | $2,915 | Principal & Interest | Variable | $0 | $350 | 60% |
Top 100 rental yield suburbs in Australia for houses
| Rank | Suburb (Postcode) | State | LGA | Median Price | Weekly Median Rent | Gross Rental Yield |
|---|---|---|---|---|---|---|
| 1st | Lightning Ridge (2834) | NSW | Walgett | $80,500 | $300 | 19.4% |
| 2nd | Coolgardie (6429) | WA | Coolgardie | $129,000 | $400 | 16.1% |
| 3rd | Tom Price (6751) | WA | Ashburton | $685,000 | $1,740 | 13.2% |
| 4th | Kambalda East (6442) | WA | Coolgardie | $150,000 | $360 | 12.5% |
| 5th | Collinsville (4804) | QLD | Whitsunday | $169,000 | $380 | 11.7% |
| 6th | Kambalda West (6442) | WA | Coolgardie | $178,500 | $380 | 11.1% |
| 7th | Millars Well (6714) | WA | Karratha | $524,000 | $1,100 | 10.9% |
| 8th | Pioneer (4825) | QLD | Mount Isa | $187,500 | $390 | 10.8% |
| 9th | South Boulder (6432) | WA | Kalgoorlie-Boulder | $235,500 | $485 | 10.70% |
| 10th | The Gap (4825) | QLD | Mount Isa | $215,000 | $440 | 10.6% |
| 11th | Port Hedland (6721) | WA | Port Hedland | $739,000 | $1,500 | 10.60% |
| 12th | South Hedland (6722) | WA | Port Hedland | $468,500 | $950 | 10.50% |
| 13th | Nickol (6714) | WA | Karratha | $594,500 | $1,200 | 10.50% |
| 14th | Baynton (6714) | WA | Karratha | $710,000 | $1,400 | 10.30% |
| 15th | Pegs Creek (6714) | WA | Karratha | $510,000 | $1,000 | 10.20% |
| 16th | Newman (6753) | WA | East Pilbara | $333,500 | $650 | 10.10% |
| 17th | Port Pirie West (5540) | SA | Port Pirie | $180,000 | $350 | 10.10% |
| 18th | Dareton (2717) | NSW | Wentworth | $180,000 | $345 | 10.00% |
| 19th | Dysart (4745) | QLD | Isaac | $210,000 | $400 | 9.90% |
| 20th | Boulder (6432) | WA | Kalgoorlie-Boulder | $289,000 | $550 | 9.90% |
| 21st | Moura (4718) | QLD | Banana | $204,000 | $385 | 9.80% |
| 22nd | Parkside (4825) | QLD | Mount Isa | $262,500 | $480 | 9.50% |
| 23rd | Bulgarra (6714) | WA | Karratha | $520,000 | $950 | 9.50% |
| 24th | Sunset (4825) | QLD | Mount Isa | $256,500 | $465 | 9.40% |
| 25th | Kalgoorlie (6430) | WA | Kalgoorlie-Boulder | $332,750 | $600 | 9.40% |
| 26th | Wandoan (4419) | QLD | Western Downs | $200,000 | $360 | 9.40% |
| 27th | Menzies (4825) | QLD | Mount Isa | $228,500 | $410 | 9.30% |
| 28th | Moranbah (4744) | QLD | Isaac | $364,500 | $650 | 9.30% |
| 29th | Happy Valley (4825) | QLD | Mount Isa | $273,500 | $485 | 9.20% |
| 30th | Broken Hill (2880) | NSW | Broken Hill | $195,000 | $345 | 9.20% |
| 31st | Merredin (6415) | WA | Merredin | $215,000 | $380 | 9.20% |
| 32nd | Derby (6728) | WA | Derby-West Kimberley | $245,000 | $430 | 9.10% |
| 33rd | Blackwater (4717) | QLD | Central Highlands (Qld) | $240,000 | $418 | 9.00% |
| 34th | Queenstown (7467) | TAS | West Coast | $174,000 | $300 | 9.00% |
| 35th | Tennant Creek (0860) | NT | Barkly | $263,500 | $450 | 8.90% |
| 36th | Djugun (6725) | WA | Broome | $710,000 | $1,200 | 8.80% |
| 37th | Charleville (4470) | QLD | Murweh | $175,000 | $295 | 8.80% |
| 38th | Ravensthorpe (6346) | WA | Ravensthorpe | $220,000 | $370 | 8.70% |
| 39th | Piccadilly (6430) | WA | Kalgoorlie-Boulder | $389,500 | $650 | 8.70% |
| 40th | Katherine East (0850) | NT | Katherine | $330,000 | $550 | 8.70% |
| 41st | West Lamington (6430) | WA | Kalgoorlie-Boulder | $394,500 | $650 | 8.60% |
| 42nd | Townview (4825) | QLD | Mount Isa | $267,500 | $440 | 8.60% |
| 43rd | Peterborough (5422) | SA | Peterborough | $180,000 | $295 | 8.50% |
| 44th | Mount Morgan (4714) | QLD | Rockhampton | $245,000 | $400 | 8.50% |
| 45th | Healy (4825) | QLD | Mount Isa | $370,000 | $600 | 8.40% |
| 46th | South Kalgoorlie (6430) | WA | Kalgoorlie-Boulder | $370,000 | $595 | 8.40% |
| 47th | Warracknabeal (3393) | VIC | Yarriambiack | $197,000 | $315 | 8.30% |
| 48th | Zeehan (7469) | TAS | West Coast | $195,000 | $310 | 8.30% |
| 49th | Winston (4825) | QLD | Mount Isa | $252,000 | $400 | 8.30% |
| 50th | Katherine South (0850) | NT | Katherine | $280,000 | $443 | 8.20% |
| 51st | Lamington (6430) | WA | Kalgoorlie-Boulder | $412,500 | $650 | 8.20% |
| 52nd | Solomontown (5540) | SA | Port Pirie | $242,000 | $380 | 8.20% |
| 53rd | Katanning (6317) | WA | Katanning | $261,250 | $410 | 8.20% |
| 54th | Karloo (6530) | WA | Greater Geraldton | $278,000 | $430 | 8.00% |
| 55th | Clermont (4721) | QLD | Isaac | $260,000 | $400 | 8.00% |
| 56th | Narrogin (6312) | WA | Narrogin | $262,000 | $400 | 7.90% |
| 57th | South Lismore (2480) | NSW | Lismore | $325,000 | $495 | 7.90% |
| 58th | Hannans (6430) | WA | Kalgoorlie-Boulder | $492,500 | $750 | 7.90% |
| 59th | Depot Hill (4700) | QLD | Rockhampton | $260,500 | $395 | 7.90% |
| 60th | Somerville (6430) | WA | Kalgoorlie-Boulder | $529,000 | $800 | 7.90% |
| 61st | Jurien Bay (6516) | WA | Dandaragan | $268,000 | $400 | 7.80% |
| 62nd | Coonamble (2829) | NSW | Coonamble | $190,000 | $283 | 7.70% |
| 63rd | Bilingurr (6725) | WA | Broome | $740,500 | $1,100 | 7.70% |
| 64th | Hopetoun (6348) | WA | Ravensthorpe | $305,500 | $450 | 7.70% |
| 65th | East Bairnsdale (3875) | VIC | East Gippsland | $340,000 | $500 | 7.60% |
| 66th | Cable Beach (6726) | WA | Broome | $680,000 | $1,000 | 7.60% |
| 67th | Charters Towers City (4820) | QLD | Charters Towers | $249,000 | $365 | 7.60% |
| 68th | Soldiers Hill (4825) | QLD | Mount Isa | $327,500 | $480 | 7.60% |
| 69th | St George (4487) | QLD | Balonne | $270,000 | $390 | 7.50% |
| 70th | Rangeway (6530) | WA | Greater Geraldton | $280,000 | $400 | 7.40% |
| 71st | Kununurra (6743) | WA | Wyndham-East Kimberley | $455,500 | $650 | 7.40% |
| 72nd | Cobar (2835) | NSW | Cobar | $235,500 | $335 | 7.40% |
| 73rd | East Innisfail (4860) | QLD | Cassowary Coast | $297,500 | $420 | 7.30% |
| 74th | Longreach (4730) | QLD | Longreach | $237,500 | $335 | 7.30% |
| 75th | Dampier (6713) | WA | Karratha | $780,000 | $1,100 | 7.30% |
| 76th | Ingham (4850) | QLD | Hinchinbrook | $257,000 | $360 | 7.30% |
| 77th | Capella (4723) | QLD | Central Highlands (Qld) | $300,000 | $420 | 7.30% |
| 78th | Richmond Hill (4820) | QLD | Charters Towers | $282,500 | $393 | 7.20% |
| 79th | Ceduna (5690) | SA | Ceduna | $260,000 | $360 | 7.20% |
| 80th | Roxby Downs (5725) | SA | Roxby Downs | $275,000 | $380 | 7.20% |
| 81st | Moree (2400) | NSW | Moree Plains | $290,000 | $400 | 7.20% |
| 82nd | Emerald (4720) | QLD | Central Highlands (Qld) | $399,000 | $550 | 7.20% |
| 83rd | Port Augusta (5700) | SA | Port Augusta | $240,000 | $330 | 7.20% |
| 84th | Whyalla Norrie (5608) | SA | Whyalla | $219,500 | $300 | 7.10% |
| 85th | Cardwell (4849) | QLD | Cassowary Coast | $377,500 | $515 | 7.10% |
| 86th | Dongara (6525) | WA | Irwin | $330,000 | $450 | 7.10% |
| 87th | Ouyen (3490) | VIC | Mildura | $235,000 | $320 | 7.10% |
| 88th | The Gap (0870) | NT | Alice Springs | $360,000 | $490 | 7.10% |
| 89th | Whyalla Stuart (5608) | SA | Whyalla | $206,000 | $280 | 7.10% |
| 90th | Peak Hill (2869) | NSW | Parkes | $222,000 | $300 | 7.00% |
| 91st | Collie (6225) | WA | Collie | $370,000 | $500 | 7.00% |
| 92nd | Dimboola (3414) | VIC | Hindmarsh | $260,000 | $350 | 7.00% |
| 93rd | Northam (6401) | WA | Northam | $350,000 | $470 | 7.00% |
| 94th | Boggabri (2382) | NSW | Narrabri | $280,000 | $375 | 7.00% |
| 95th | Manjimup (6258) | WA | Manjimup | $375,000 | $500 | 6.90% |
| 96th | Gray (0830) | NT | Palmerston | $410,000 | $545 | 6.90% |
| 97th | Gillen (0870) | NT | Alice Springs | $431,250 | $570 | 6.90% |
| 98th | Mornington (4825) | QLD | Mount Isa | $303,500 | $400 | 6.90% |
| 99th | Bakers Creek (4740) | QLD | Mackay | $572,250 | $750 | 6.80% |
| 100th | Araluen (870) | NT | Alice Springs | $545,000 | $710 | 6.80% |
Source: CoreLogic. Data reported to the period ending January 2025. Median values account for sales transactions over 12 months.
Top 100 rental yield suburbs in Australia for units
| Rank | Suburb (Postcode) | State | LGA | Median Price | Weekly Median Rent | Gross Rental Yield |
|---|---|---|---|---|---|---|
| 1st | Bucasia (4750) | QLD | Mackay | $130,000 | $380 | 15.2% |
| 2nd | Baynton (6714) | WA | Karratha | $515,000 | $1,325 | 13.40% |
| 3rd | South Hedland (6722) | WA | Port Hedland | $290,000 | $700 | 12.60% |
| 4th | Pegs Creek (6714) | WA | Karratha | $410,000 | $975 | 12.40% |
| 5th | Cable Beach (6726) | WA | Broome | $330,000 | $750 | 11.80% |
| 6th | Moranbah (4744) | QLD | Isaac | $330,000 | $750 | 11.80% |
| 7th | Roxby Downs (5725) | SA | Roxby Downs | $135,000 | $300 | 11.60% |
| 8th | Brassall (4305) | QLD | Ipswich | $205,000 | $450 | 11.40% |
| 9th | Port Hedland (6721) | WA | Port Hedland | $378,561 | $800 | 11.00% |
| 10th | Broome (6725) | WA | Broome | $332,500 | $700 | 10.90% |
| 11th | Bulgarra (6714) | WA | Karratha | $293,500 | $615 | 10.90% |
| 12th | Somerville (6430) | WA | Kalgoorlie-Boulder | $287,500 | $600 | 10.90% |
| 13th | Boulder (6432) | WA | Kalgoorlie-Boulder | $230,000 | $475 | 10.70% |
| 14th | Newman (6753) | WA | East Pilbara | $225,000 | $450 | 10.40% |
| 15th | Driver (0830) | NT | Palmerston | $240,000 | $460 | 10.00% |
| 16th | Karama (0812) | NT | Darwin | $260,000 | $468 | 9.40% |
| 17th | Piccadilly (6430) | WA | Kalgoorlie-Boulder | $282,500 | $500 | 9.20% |
| 18th | Beresford (6530) | WA | Greater Geraldton | $255,000 | $450 | 9.20% |
| 19th | Whyalla Playford (5600) | SA | Whyalla | $160,000 | $280 | 9.10% |
| 20th | Kalgoorlie (6430) | WA | Kalgoorlie-Boulder | $300,000 | $520 | 9.00% |
| 21st | Bakewell (0832) | NT | Palmerston | $282,500 | $480 | 8.80% |
| 22nd | Sadadeen (0870) | NT | Alice Springs | $265,000 | $450 | 8.80% |
| 23rd | Larapinta (0875) | NT | Alice Springs | $270,000 | $450 | 8.70% |
| 24th | Rosebery (0832) | NT | Palmerston | $319,000 | $520 | 8.50% |
| 25th | Djugun (6725) | WA | Broome | $429,500 | $700 | 8.50% |
| 26th | Gray (0830) | NT | Palmerston | $270,000 | $440 | 8.50% |
| 27th | Melbourne (3000) | VIC | Melbourne | $400,000 | $650 | 8.50% |
| 28th | Cardwell (4849) | QLD | Cassowary Coast | $230,000 | $370 | 8.40% |
| 29th | Notting Hill (3168) | VIC | Monash | $342,500 | $550 | 8.40% |
| 30th | Cranbrook (4814) | QLD | Townsville | $238,000 | $380 | 8.30% |
| 31st | Deagon (4017) | QLD | Brisbane | $240,000 | $380 | 8.20% |
| 32nd | Heatherton (3202) | VIC | Kingston (Vic.) | $319,000 | $505 | 8.20% |
| 33rd | Bellamack (0832) | NT | Palmerston | $350,000 | $550 | 8.20% |
| 34th | Emerald (4720) | QLD | Central Highlands (Qld) | $256,500 | $400 | 8.10% |
| 35th | Marrara (0812) | NT | Darwin | $315,000 | $490 | 8.10% |
| 36th | Northam (6401) | WA | Northam | $210,000 | $325 | 8.00% |
| 37th | Withers (6230) | WA | Bunbury | $240,000 | $370 | 8.00% |
| 38th | Edmonton (4869) | QLD | Cairns | $279,000 | $430 | 8.00% |
| 39th | Leanyer (0812) | NT | Darwin | $331,000 | $510 | 8.00% |
| 40th | Southside (4570) | QLD | Gympie | $234,000 | $360 | 8.00% |
| 41st | Millner (0810) | NT | Darwin | $312,500 | $480 | 8.00% |
| 42nd | Manunda (4870) | QLD | Cairns | $250,000 | $380 | 7.90% |
| 43rd | Kununurra (6743) | WA | Wyndham-East Kimberley | $360,000 | $538 | 7.80% |
| 44th | Darwin City (0800) | NT | Darwin | $410,000 | $600 | 7.60% |
| 45th | Jubilee Pocket (4802) | QLD | Whitsunday | $342,500 | $500 | 7.60% |
| 46th | Gillen (0870) | NT | Alice Springs | $275,000 | $400 | 7.60% |
| 47th | Whyalla (5600) | SA | Whyalla | $172,000 | $250 | 7.60% |
| 48th | Douglas (4814) | QLD | Townsville | $317,500 | $460 | 7.50% |
| 49th | Johnston (0832) | NT | Palmerston | $360,000 | $520 | 7.50% |
| 50th | Thornlie (6108) | WA | Gosnells | $381,500 | $550 | 7.50% |
| 51st | Wongaling Beach (4852) | QLD | Cassowary Coast | $250,000 | $360 | 7.50% |
| 52nd | Travancore (3032) | VIC | Moonee Valley | $362,000 | $520 | 7.50% |
| 53rd | Bayswater (6053) | WA | Bayswater | $418,000 | $600 | 7.50% |
| 54th | South Kalgoorlie (6430) | WA | Kalgoorlie-Boulder | $350,000 | $500 | 7.40% |
| 55th | Woolner (0820) | NT | Darwin | $420,000 | $600 | 7.40% |
| 56th | Erskine (6210) | WA | Mandurah | $367,500 | $520 | 7.40% |
| 57th | Coolalinga (0839) | NT | Litchfield | $299,000 | $423 | 7.30% |
| 58th | West Mackay (4740) | QLD | Mackay | $340,000 | $480 | 7.30% |
| 59th | Glendalough (6016) | WA | Stirling | $390,000 | $550 | 7.30% |
| 60th | Freshwater (4870) | QLD | Cairns | $377,000 | $530 | 7.30% |
| 61st | South Gladstone (4680) | QLD | Gladstone | $235,000 | $330 | 7.30% |
| 62nd | New Auckland (4680) | QLD | Gladstone | $261,250 | $365 | 7.30% |
| 63rd | Hermit Park (4812) | QLD | Townsville | $265,000 | $370 | 7.30% |
| 64th | The Gap (0870) | NT | Alice Springs | $308,000 | $430 | 7.30% |
| 65th | Chinchilla (4413) | QLD | Western Downs | $270,000 | $375 | 7.20% |
| 66th | Perth (6000) | WA | Perth | $490,000 | $678 | 7.20% |
| 67th | Orelia (6167) | WA | Kwinana | $306,000 | $420 | 7.10% |
| 68th | Stuart Park (0820) | NT | Darwin | $420,000 | $575 | 7.10% |
| 69th | Mackay (4740) | QLD | Mackay | $330,000 | $450 | 7.10% |
| 70th | Wembley (6014) | WA | Cambridge | $385,000 | $525 | 7.10% |
| 71st | Holloways Beach (4878) | QLD | Cairns | $330,200 | $450 | 7.10% |
| 72nd | East Perth (6004) | WA | Perth | $515,000 | $700 | 7.10% |
| 73rd | Carlton (3053) | VIC | Melbourne | $405,000 | $550 | 7.10% |
| 74th | Hawker (2614) | ACT | Unincorporated ACT | $370,000 | $500 | 7.00% |
| 75th | Southbank (3006) | VIC | Melbourne | $500,000 | $675 | 7.00% |
| 76th | Parap (0820) | NT | Darwin | $422,500 | $570 | 7.00% |
| 77th | Cannonvale (4802) | QLD | Whitsunday | $379,000 | $510 | 7.00% |
| 78th | East Mackay (4740) | QLD | Mackay | $320,000 | $430 | 7.00% |
| 79th | Edge Hill (4870) | QLD | Cairns | $350,000 | $470 | 7.00% |
| 80th | Cairns North (4870) | QLD | Cairns | $357,500 | $480 | 7.00% |
| 81st | Bunbury (6230) | WA | Bunbury | $455,000 | $610 | 7.00% |
| 82nd | Nightcliff (0810) | NT | Darwin | $358,500 | $480 | 7.00% |
| 83rd | Bowen (4805) | QLD | Whitsunday | $325,000 | $435 | 7.00% |
| 84th | Northbridge (6003) | WA | Perth | $505,000 | $675 | 7.00% |
| 85th | Sorrento (6020) | WA | Joondalup | $500,000 | $668 | 6.90% |
| 86th | North Mackay (4740) | QLD | Mackay | $315,000 | $420 | 6.90% |
| 87th | Manoora (4870) | QLD | Cairns | $315,000 | $420 | 6.90% |
| 88th | Redcliffe (6104) | WA | Belmont | $450,000 | $600 | 6.90% |
| 89th | East Cannington (6107) | WA | Canning | $450,000 | $600 | 6.90% |
| 90th | Port Douglas (4877) | QLD | Douglas | $407,500 | $540 | 6.90% |
| 91st | Coconut Grove (0810) | NT | Darwin | $362,500 | $480 | 6.90% |
| 92nd | Idalia (4811) | QLD | Townsville | $340,000 | $450 | 6.90% |
| 93rd | Keswick (5035) | SA | West Torrens | $340,000 | $450 | 6.90% |
| 94th | Victoria Park (6100) | WA | Victoria Park | $450,000 | $595 | 6.90% |
| 95th | Condon (4815) | QLD | Townsville | $295,000 | $390 | 6.90% |
| 96th | South Mackay (4740) | QLD | Mackay | $342,000 | $450 | 6.80% |
| 97th | Pimlico (4812) | QLD | Townsville | $273,750 | $360 | 6.80% |
| 98th | East Victoria Park (6101) | WA | Victoria Park | $495,250 | $650 | 6.80% |
| 99th | Brinkin (0810) | NT | Darwin | $351,000 | $460 | 6.80% |
| 100th | Australind (6233) | WA | Harvey | $429,000 | $560 | 6.80% |
Source: CoreLogic. Data reported to the period ending January 2025. Median values account for sales transactions over 12 months.
First published on January 2022
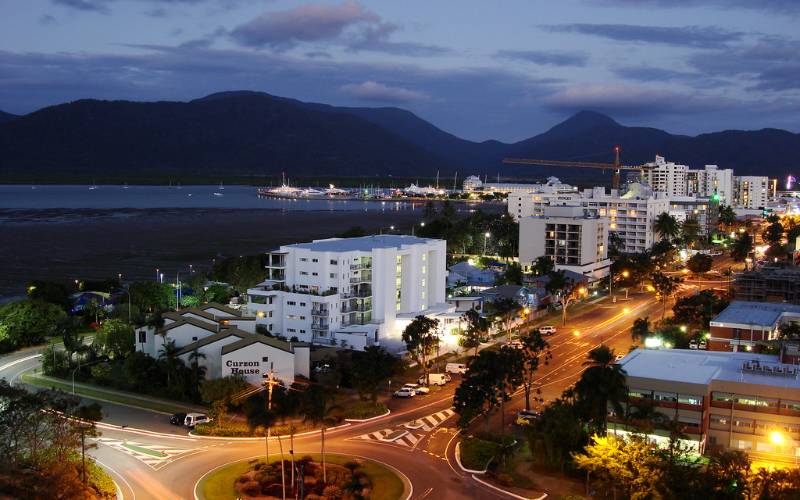
Image by Jorge Láscar on Flickr

Ready, Set, Buy!
Learn everything you need to know about buying property – from choosing the right property and home loan, to the purchasing process, tips to save money and more!
With bonus Q&A sheet and Crossword!


 Arjun Paliwal

 Denise Raward