
Net overseas migration (NOM) has accounted for 51% of Australia's population growth in the last thirty years, and 60% since late 2016.
CoreLogic Head of Research, Tim Lawless, said population growth had been a long standing driver of economic growth for the country, underpinning residential construction activity and rental demand.
Buying a home or looking to refinance? The table below features home loans with some of the lowest variable interest rates on the market for owner occupiers.
| Lender | Home Loan | Interest Rate | Comparison Rate* | Monthly Repayment | Repayment type | Rate Type | Offset | Redraw | Ongoing Fees | Upfront Fees | Max LVR | Lump Sum Repayment | Extra Repayments | Split Loan Option | Tags | Features | Link | Compare | Promoted Product | Disclosure |
|---|---|---|---|---|---|---|---|---|---|---|---|---|---|---|---|---|---|---|---|---|
5.54% p.a. | 5.58% p.a. | $2,852 | Principal & Interest | Variable | $0 | $530 | 90% |
| Promoted | Disclosure | ||||||||||
5.49% p.a. | 5.40% p.a. | $2,836 | Principal & Interest | Variable | $0 | $0 | 80% |
| Promoted | Disclosure | ||||||||||
5.64% p.a. | 5.89% p.a. | $2,883 | Principal & Interest | Variable | $250 | $250 | 60% |
| Promoted | Disclosure | ||||||||||
5.64% p.a. | 5.89% p.a. | $2,883 | Principal & Interest | Variable | $248 | $350 | 60% |
| Disclosure |


")

Mr Lawless said the lack of migrants would see a higher volume of rent listing and falling rent values across key inner city precincts.
"This phenomenon is already being observed, particularly across inner Sydney and Melbourne," Mr Lawless said.
"Once foreign student arrivals start to normalise, rental demand in these areas may improve.
"In the meantime, investors who own property in these locations are likely to be facing high vacancy rates, lower rents and reduced ability to service their mortgage."
Mr Lawless said stalled NOM was also likely to see a higher proportion of units settling with a valuation lower than the contract price, again particularly in Sydney and Melbourne.
"ABS (Australian Bureau of Statistics) building activity data showed there were more than 50,000 units under construction across NSW at the end of March, and just over 45,000 across Victoria," he said.
"A large proportion of these are high-rise projects in inner city locations.
"Many of these yet-to-be completed projects will settle while rental vacancies remain high and rents are falling, which may put downwards pressure on property values."
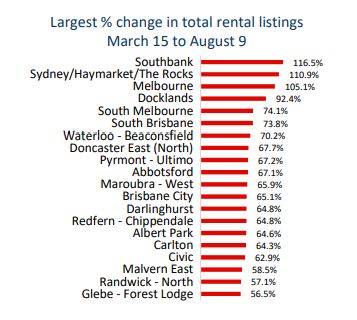
Melbourne and Sydney rent listings already spiking sharply
Last year 84% of all overseas migration flowed into the nation's capitals, with three quarters of those taking up residence in Sydney and Melbourne.
Mr Lawless said the impact of the sharp fall in overseas of arrival was already being felt, with rental listings doubling in some inner city precincts.
"Between mid-March and early-August, the number of homes available for rent in Melbourne’s Southbank rose by 117% to reach 1,230 advertised rental listings," he said.
"Rental ads were up 111% across the Sydney CBD/Haymarket/The Rocks region to reach 776 and Melbourne’s CBD saw a 105% lift in advertised rentals taking the total number of homes available to rent to 2,184."
Source: CoreLogic
However, this couldn't all be attributed to declined NOM, with these areas also greatly affected by the rise in unemployment.
Mr Lawless said the rise in listings was already weighing on rental income, most prominently in units.
"Every capital city is showing a larger fall in unit rents relative to house rents through the COVID period to-date, with a more significant difference in Melbourne and Sydney where unit rents are down more than 4% since March."
Local migration to increase in importance
Mr Lawless said the low NOM would see organic drivers of housing demand become more important, particularly through interstate and intrastate migration.
"Internal migration flows are influenced by a range of factors, but local economic and labour market conditions are key draw cards, as well as lifestyle and housing prices," Mr Lawless said.
"There are already signs that major regional centres are benefitting from increased demand as some people look to escape the large cities, taking advantage of remote working opportunities, more affordable housing options and lifestyle considerations."

Ready, Set, Buy!
Learn everything you need to know about buying property – from choosing the right property and home loan, to the purchasing process, tips to save money and more!
With bonus Q&A sheet and Crossword!


 Harry O'Sullivan
 Bea Garcia
 Denise Raward
 Harrison Astbury
 Alex Brewster