The average reduction in the asking price of Brisbane houses has increased, which the city hasn’t seen since July 2020.
The areas include: Sherwood-Indooroopilly, Brisbane Inner North, Nundah, Nathan, Carindale, Kenmore-Brookfield-Moggill, The Gap-Enoggera, Springwood-Kingston, Holland Park-Yeronga, and Mt Gravatt.
Dr Nicola Powell, Domain chief of research and economics, said Brisbane’s red-hot market is beginning to slow due to the RBA’s recent cash rate increase and the amount of choice available on the market.
“Discounting is such a great indicator of that subtle change in sentiment,” Dr Powell said.
“There’s always a level of discounting in the market, no matter the conditions – but it’s the direction of where the discounting is going that gives us an idea of the health of the market.
“If discounting is rising, we’re selling homes for lower than the asking price.”
Where are houses selling for less than their asking price in Brisbane?
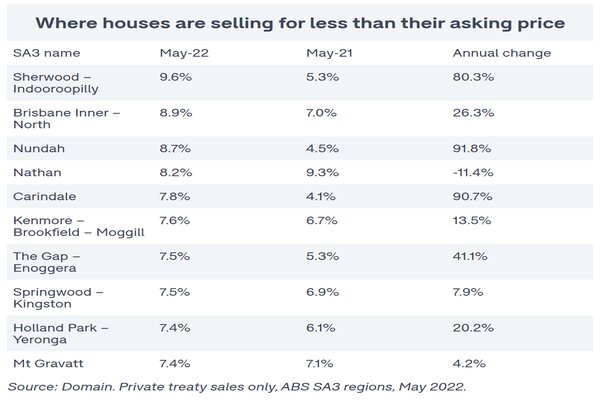
The Nundah and Carindale regions recorded the most significant spike in discounting this year with more than 90% since May 2021. On average, houses sold for 8.7% and 7.8% lower than their asking price.
The region of Sherwood-Indooroopilly, which includes suburbs such as Taringa, Corinda, Chelmer, and Graceville followed suit with an 80.3% rise.
Brisbane’s Inner-North region also saw a notable increase in discounting which saw houses selling for 8.9% lower than their asking price. This is up 26.3% compared to May 2021.
Slight fall in asking prices but still elevated
SQM Research data for the week ending 7 June revealed asking prices in Brisbane declined 0.6% for units over the week, but remain up 4.3% for houses.
Over the month asking prices for units outpaced houses at 2.1% versus 1.9% respectively.
Asking prices were, on average, $451,200 for units and $764,500 for houses for the week.
The proportion of properties on the market for more than 180 days decreased 5.5% over the month and 57.3% annually for Brisbane.
This contrasts with other markets such as Sydney, with combined asking prices falling 14.5%.
The proportion of properties on the market for more than 180 days increased 9.6% on the month.
Despite the RBA's tightening cycle now underway, SQM Research managing director Louis Christopher said it might be some time until there are material red flags in the market.
"I am not expecting a large rise in forced sales as yet. Let's recall the lending rate serviceability test has been with us for years now. It should mean most property owners will be able to handle a home lending rate of 6%," Mr Christopher said.
"The picture changes if lending rates rise to 7%, in my opinion. Because very few borrowers have been tested on a theoretical lending rate of 7%."
Mr Christopher said it's unlikely the RBA will be so aggressive as to push mortgage rates over 7%.
"They know full well a housing market crash will smash the economy into recession, and with that their reputation - which I know firsthand the RBA boffins worry most about - being taken to the abyss."
Brisbane market resilient despite cash rate increases
PRD chief economist Dr Asti Mardiasmo believes Brisbane can survive the 50 basis point cash rate increase with data showing that the city has done it before in previous years.
“The last time the RBA increased the cash rate by 50 basis points was back in February 2000,” Dr Mardiasmo said.
“The Brisbane LGA median house price was $164,000 in 1999, with a cash rate of 4.75%. It raised to $175,000 in 2000 with a cash rate of 5.75%, and again to $197,000 in 2001 with a cash rate of 5.75%.
“The next cash rate increase was in May 2006, but only by 25 basis points. This time again, Brisbane LGA median house prices thrived.”
Despite cash rate changes among the years, the Brisbane property market has continued on a growth trajectory according to Dr Mardiasmo.
“We may see a very slight softening in the market, followed by a levelling, before picking up steam again in Brisbane," she said.
Advertisement
Buying a home or looking to refinance? The table below features home loans with some of the lowest interest rates on the market for owner occupiers.
| Lender | Home Loan | Interest Rate | Comparison Rate* | Monthly Repayment | Repayment type | Rate Type | Offset | Redraw | Ongoing Fees | Upfront Fees | Max LVR | Lump Sum Repayment | Extra Repayments | Split Loan Option | Tags | Features | Link | Compare | Promoted Product | Disclosure |
|---|---|---|---|---|---|---|---|---|---|---|---|---|---|---|---|---|---|---|---|---|
5.54% p.a. | 5.58% p.a. | $2,852 | Principal & Interest | Variable | $0 | $530 | 90% |
| Promoted | Disclosure | ||||||||||
5.49% p.a. | 5.40% p.a. | $2,836 | Principal & Interest | Variable | $0 | $0 | 80% |
| Promoted | Disclosure | ||||||||||
5.64% p.a. | 5.89% p.a. | $2,883 | Principal & Interest | Variable | $250 | $250 | 60% |
| Promoted | Disclosure | ||||||||||
5.64% p.a. | 5.89% p.a. | $2,883 | Principal & Interest | Variable | $248 | $350 | 60% |
| Disclosure |


")

Image by PhotoMIX Company via Pexels

Ready, Set, Buy!
Learn everything you need to know about buying property – from choosing the right property and home loan, to the purchasing process, tips to save money and more!
With bonus Q&A sheet and Crossword!


 Bea Garcia
 Denise Raward
 Harry O'Sullivan
 Emma Duffy