Victoria led the surge, with a 96% jump in new car sales compared to September 2020, despite being the most locked-down state.
The only states to record negative data was the ACT, down 35%, and NSW down 8%.
The overall results were bolstered by large purchases from rental companies and for Government fleets.
For Victoria in particular, the car rental market is up 348.9%, and Government fleet purchasing is up 143% on August's sales.
FCAI chief Tony Weber said the overall results are "bittersweet" for what could have been had there not been lockdowns.
"In many respects these figures give the industry great encouragement and excitement for what will be possible in 2022 when lockdowns will hopefully be a thing of the past," Mr Weber said.
All up there were 83,312 vehicles sold in September 2021, with nearly three quarters of those being utes and SUVs.
"The sports utility market is up by 25% and the light commercial market up 27%. With over 150 models on offer in these segments, competition amongst brands is delivering the best technology and lowest prices for Australian families looking to break out of lockdown with a road trip," Mr Weber said.
There have been more than 800,000 vehicles solid in the 2021 year to date, and with three months to go, the industry could record more than one million vehicle sales.
Top Selling Vehicles - September 2021
Toyota was once again the market-leading brand, with more than 13,000 sales, while MG made the top ten, led by the cheapest electric SUV in the market, the 'ZS'.
There was little variation to the top selling models, with a slight reshuffling in the rankings with the Corolla slotting into third spot:
- Ford Ranger - 4,192 units
- Toyota Hilux - 3,635
- Toyota Corolla - 3,487
- Toyota RAV4 - 3,390
- Toyota Prado - 2,173
- Hyundai i30 - 2,034
- Isuzu Ute D-MAX - 1,833
- Toyota Camry - 1,610
- Toyota Landcruiser - 1,541
- Mitsubishi ASX - 1,489
Electric vehicles continue surge
Compared to September last year there was a 189.4% jump in fully-electric vehicles, with 305 units sold in September 2021.
Fully-electric SUV sales are up more than 400%.
There has also been 35 hydrogen cars sold so far in 2021, largely due to government fleet purchasing.
Of these 35, nine were the Toyota Mirai, and 26 were the Hyundai Nexo, of which 20 have been purchased by the ACT Government, while five were purchased by the Queensland Government.
The results come after it was announced Ford will enter the Australian electric vehicle market in early 2022, starting with the e-Transit van and not the hyped 'Mach E' crossover, which is popular in the United States.
Hydrogen car manufacturer 'H2X Global' has also announced it is set to launch Australia's first hydrogen ute in November, called the 'Warrego'.
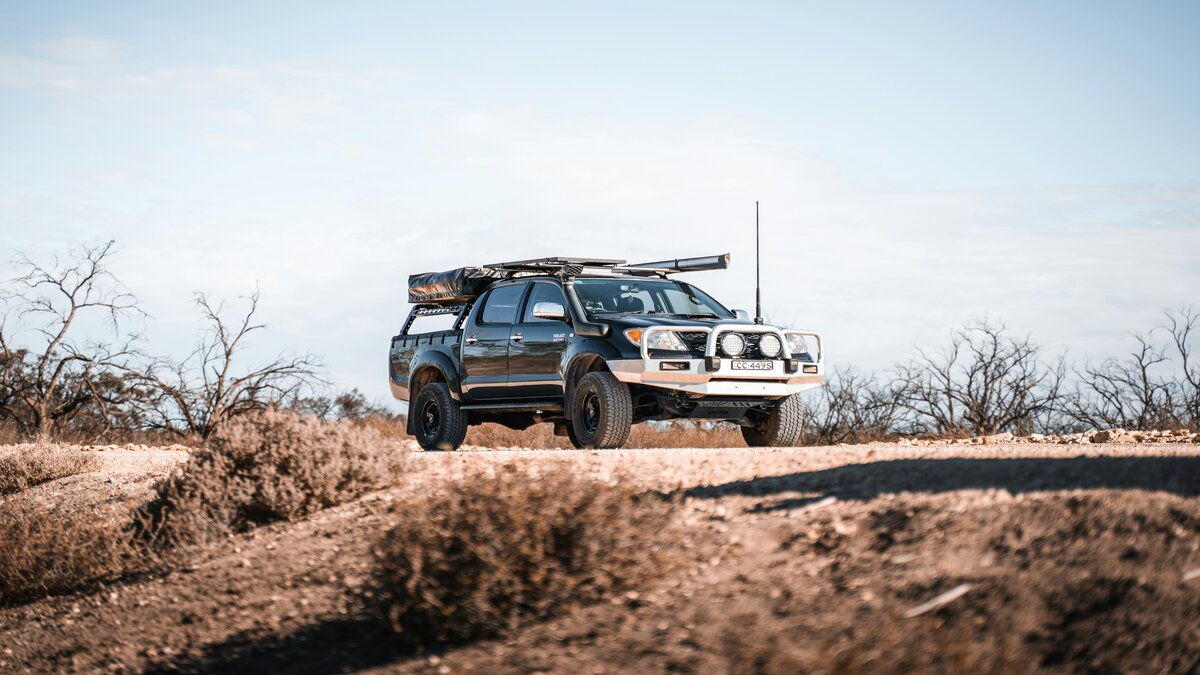
Photo by William Christen on Unsplash

.jpg)

 Denise Raward
 Harry O'Sullivan