Dwelling values grew 0.3% last month, recording a lift in every capital city.
The rise in home values has added another $2,720 to the median value of an Australian dwelling in just one month, according to the latest Cotality (formerly CoreLogic) data.
It marks the third straight month of growth although the growth rate eased from March's figure of 0.4%, with homebuyer sentiment and auction clearance rates also dropping.
Cotality's research director Tim Lawless said while February's long-awaited cut to the cash rate boosted housing market conditions, the influence from lower interest rates seems to be losing steam.
"Household confidence slipped in April with the US's 'Liberation Day' tariff announcements and the upcoming federal election causing uncertainty," Mr Lawless said.
"It's likely this may be causing some buyers and sellers to delay their decisions."
Wait and see on housing promises
Housing has been a key battleground during the election campaign with both Labor and the Opposition promising to help more people into homeownership.
See also: Labor, Coalition announce fresh housing promises
It seems uncertainty surrounding housing schemes has been more apparent in lower sales and listing volumes over April, although this also likely reflects the extended break many people took between Easter and ANZAC Day.
This month's widely expected cut to the cash rate may also be having an effect with some prospective buyers waiting to take advantage of lower home loan interest rates.
On Wednesday, the latest Consumer Price Index data revealed an annualised underlying inflation figure of 2.9%, dipping into the Reserve Bank of Australia's target range of between 2-3% for the first time in more than three years.
Economists and commentators are almost universal in predicting the RBA board will cut the cash rate by 25 basis points at its next meeting on 19-20 May.
By this time, Australia will also have its new federal government and it will be clearer which housing promises may be enacted.
What will happen to housing after the federal election?
Both sides of politics have pledged to contribute funding to the building of new homes.
A Coalition government would contribute $5 billion to improving infrastructure to facilitate new home construction while Labor has promised $10 billion towards the construction of up to 100,000 new affordable homes that only first-home buyers can purchase.
But commentators have criticised homeownership promises on both sides of the political divide, arguing they will only drive demand and home values higher.
The Coalition has promised to make interest payments for some first homebuyers tax deductible and implement reforms to lower the home loan serviceability buffer.
Meantime, Labor has promised to expand the existing First Home Buyer Guarantee scheme to all first homebuyers.
Listen to Chief Economist of the Centre for Independent Studies Peter Tulip critiquing federal election housing promises on the latest episode of the Savings Tip Jar podcast.
Which cities are seeing highest price growth?
Politics aside, Australia's home values have recorded a broad-based rise but not all markets are at record highs.
That remains the domain of the mid-sized capitals - Perth, Adelaide, and Brisbane - while the rest of the capitals remain below their peaks.
Darwin led monthly price growth with a 1.1% rise over April while Sydney and Melbourne had the lowest growth rates of 0.2%.
Melbourne home values remain 5.4% down from their highest level in 2022.
Meantime, regional housing values have continued to outpace the capitals with values up 0.6% over the month.
Regional areas of both South Australia and Western Australia recorded the most significant gains of 1.5% and 1.3% respectively.
Rental growth has also firmed in 2025 with the national rental index rising by 0.6% for the first three months of the year.
But adjusting for seasonal effects, the pace of growth slowed to 0.4% nationally for April.
Cotality data shows rental growth has more than halved on an annual basis, down from 8.3% over the 12 months to April 2024 to 3.6% over the most recent 12-month period.
Advertisement
Buying a home or looking to refinance? The table below features home loans with some of the lowest interest rates on the market for owner occupiers.
| Lender | Home Loan | Interest Rate | Comparison Rate* | Monthly Repayment | Repayment type | Rate Type | Offset | Redraw | Ongoing Fees | Upfront Fees | Max LVR | Lump Sum Repayment | Extra Repayments | Split Loan Option | Tags | Features | Link | Compare | Promoted Product | Disclosure |
|---|---|---|---|---|---|---|---|---|---|---|---|---|---|---|---|---|---|---|---|---|
5.54% p.a. | 5.58% p.a. | $2,852 | Principal & Interest | Variable | $0 | $530 | 90% |
| Promoted | Disclosure | ||||||||||
5.49% p.a. | 5.40% p.a. | $2,836 | Principal & Interest | Variable | $0 | $0 | 80% |
| Promoted | Disclosure | ||||||||||
5.64% p.a. | 5.89% p.a. | $2,883 | Principal & Interest | Variable | $250 | $250 | 60% |
| ||||||||||||
5.64% p.a. | 5.89% p.a. | $2,883 | Principal & Interest | Variable | $248 | $350 | 60% |
|


")

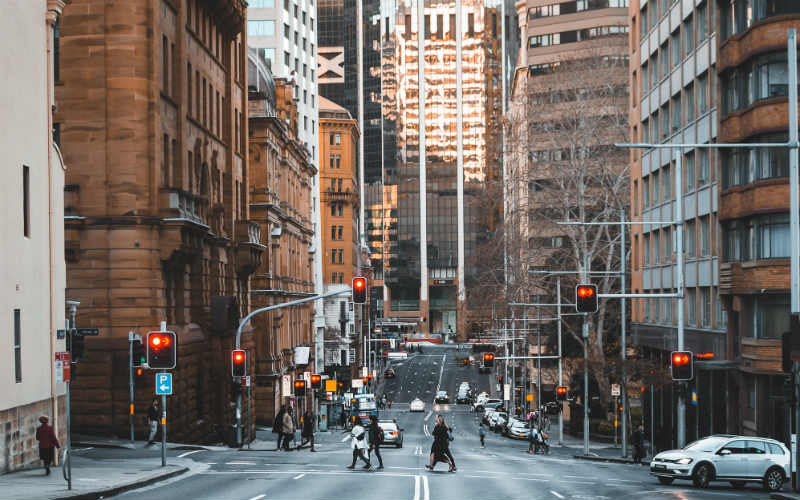
Image by Michael Tuszynski via Pexels

Ready, Set, Buy!
Learn everything you need to know about buying property – from choosing the right property and home loan, to the purchasing process, tips to save money and more!
With bonus Q&A sheet and Crossword!

 Jacob Cocciolone
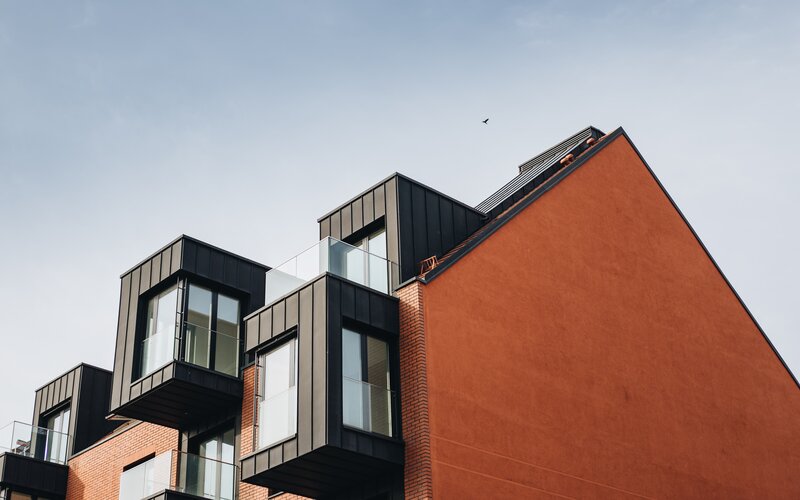
 Harry O'Sullivan