
SQM Research figures released Tuesday revealed national residential property listings fell in December 2021 by 6.5% to 218,415 from the 233,716 recorded in November.
Three key property performers through the year in Sydney, Melbourne and Canberra all recorded the greatest falls in listings of 15.8%, 12.9% and 15.9% respectively across the month of December.
Nationally, new listings of fewer than 30 days fell 29.5% over December 2021 to 67,972 properties on the market as the silly season appeared to take priority.
Of this fall, capitals that saw the greatest decline were Sydney with a 47.4% reduction, followed by Melbourne at 40.9% and Adelaide at 37.4%.
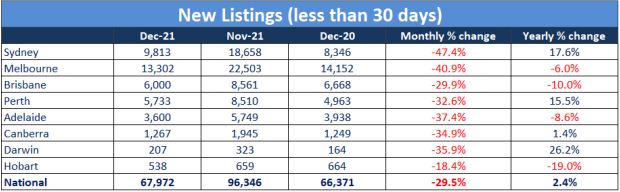
Source: SQM Research
Managing Director of SQM Research Louis Christopher said while there was a significant surge in auction activity over December, total listings were down on a month by month and a year-by-year comparison.
"Sydney did record a surge in new listings when we take out the seasonality and compare against December 2020," Mr Christopher said.
"Overall, there remains a shortage of listings at the national level and as a result, vendors are in no panic - indeed, they lifted their asking prices for the month.
"Unless we have a surge in listings for the start of the property season in February it is looking like a very soft landing for the housing market in 2022.”
Over the past 30 days to January 4, SQM Research detailed:
- Sydney asking prices rose by 1.1% for houses and 0.4% for units.
- Melbourne asking prices rose 3% for houses and fell 1% for units.
- Brisbane and Perth asking prices rose 4.2% and 0.1% for houses and 2.6% and 1.2% for units.
- Adelaide asking prices for houses rose 4.3% fell 0.5% for units.
- Canberra asking prices for houses rose 8.4% and 5% for units.
- Darwin asking prices for houses rose 1.7% and units fell 1.1%.
- Hobart asking prices for units fell by 0.4%.
Seeking a change in scenery for 2022? Check out some suburbs tipped to grow across Brisbane, Melbourne, Sydney, Adelaide, Gold Coast, Sunshine Coast and Central Coast.
Buying a home or looking to refinance? The table below features home loans with some of the lowest interest rates on the market for owner occupiers.
| Lender | Home Loan | Interest Rate | Comparison Rate* | Monthly Repayment | Repayment type | Rate Type | Offset | Redraw | Ongoing Fees | Upfront Fees | Max LVR | Lump Sum Repayment | Extra Repayments | Split Loan Option | Tags | Features | Link | Compare | Promoted Product | Disclosure |
|---|---|---|---|---|---|---|---|---|---|---|---|---|---|---|---|---|---|---|---|---|
5.54% p.a. | 5.58% p.a. | $2,852 | Principal & Interest | Variable | $0 | $530 | 90% |
| Promoted | Disclosure | ||||||||||
5.49% p.a. | 5.40% p.a. | $2,836 | Principal & Interest | Variable | $0 | $0 | 80% |
| Promoted | Disclosure | ||||||||||
5.64% p.a. | 5.89% p.a. | $2,883 | Principal & Interest | Variable | $250 | $250 | 60% |
| Promoted | Disclosure | ||||||||||
5.64% p.a. | 5.89% p.a. | $2,883 | Principal & Interest | Variable | $248 | $350 | 60% |
| Disclosure |


")

Image by Scott Webb via Unsplash

Ready, Set, Buy!
Learn everything you need to know about buying property – from choosing the right property and home loan, to the purchasing process, tips to save money and more!
With bonus Q&A sheet and Crossword!


 Bea Garcia
 Denise Raward
 Harry O'Sullivan
 Rachel Horan