Domain's housing affordability report compares suburbs across Australia by their average cost per square metre.
Paddington and Tamarama, both eastside Sydney suburbs, are the most expensive by this measure, at $25,755 and $25,684 per square metre (per sqm) respectively.
The top 10 suburbs are all in Sydney.
Of the top 66 most expensive, only Albert Park in Melbourne (26th overall, $13,915 per sqm) and Kent Town in Adelaide (65th overall, $8,937 per sqm) are outside of Sydney.
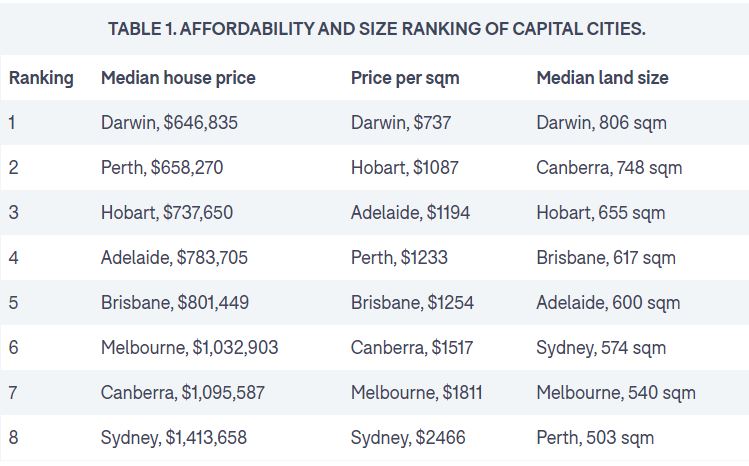
Capital cities by affordability
Darwin is currently the capital city where buyers will get the best value for land.
The Northern Territory capital has both the highest median land size (806 sqm) and the cheapest average price per sqm ($737).
Land in Darwin is 32% cheaper per sqm than Hobart, the second most affordable city ($1,087 per sqm).
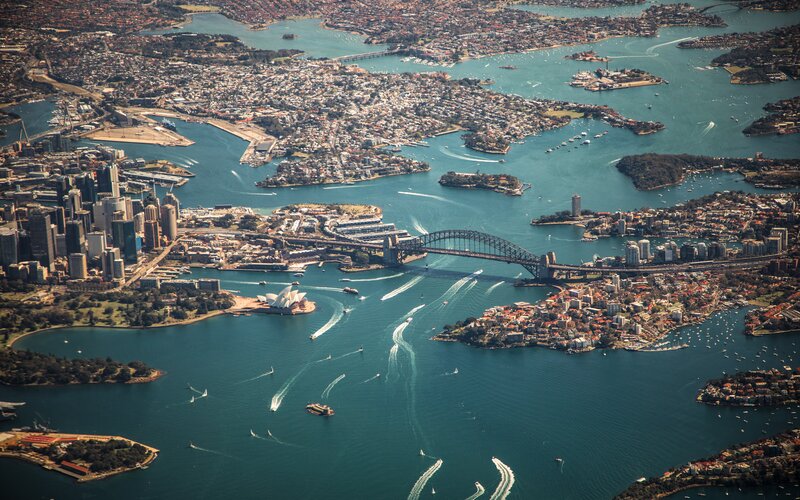
It is also over three times cheaper than in Sydney, where a square metre costs on average $2,466.
In 2012, Perth had an average price per sqm of $897, the second most expensive in the country behind Sydney.
Since then though, modest property price growth has seen it fall behind Melbourne, Sydney and Canberra, despite block sizes shrinking by 16.2%.
Buyer value shrinking in big cities
Demand for property in the larger capital cities (Sydney, Melbourne, Brisbane, Adelaide and Perth) has seen block sizes decrease by 13% in the last ten years.
While diminished block sizes helps to slow property price growth, price per sqm demonstrates buyers are getting less and less value.
"The land cost has not reduced - buyers are just purchasing less of it," said Dr Nicola Powell put it, Domain's head of research.
"As a result, areas with the largest decreases in block size have had growth in price per sqm outpace house price growth at a faster rate, meaning that the true cost to buyers is growing faster than the median house price alone suggests.”
Takeaways for buyers
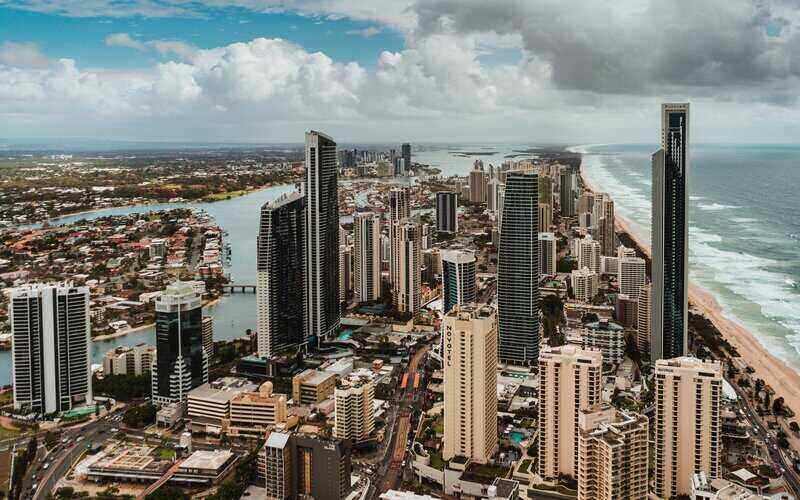
In the big cities, particularly Sydney, development is lagging behind an influx of new residents, which will likely see house prices continue to increase.
"Policy change, land release and property tax reform is needed to see a drastic change in price per sqm affordability," Dr Powell said.
She said that because of this urban density, buyers should be looking away from city centres for the best value per sqm, and that this would in turn help to ease the exorbitant costs in areas closer to central business districts.
"The city fringes offer a much cheaper price per sqm, and with more jobs moving to commercial hubs such as Parramatta and Macquarie Park, these outer areas will become more attractive due to the potential for lower workplace times." Dr Powell said.
"Having multi regional cities will help to distribute wealth across a larger area and provide equal access to education, healthcare and employment opportunities.
"This will also help to spread the cost per sqm to be less heavily centred in towards our CBDs."
Advertisement
Buying a home or looking to refinance? The table below features home loans with some of the lowest interest rates on the market for owner occupiers.
| Lender | Home Loan | Interest Rate | Comparison Rate* | Monthly Repayment | Repayment type | Rate Type | Offset | Redraw | Ongoing Fees | Upfront Fees | Max LVR | Lump Sum Repayment | Extra Repayments | Split Loan Option | Tags | Features | Link | Compare | Promoted Product | Disclosure |
|---|---|---|---|---|---|---|---|---|---|---|---|---|---|---|---|---|---|---|---|---|
5.54% p.a. | 5.58% p.a. | $2,852 | Principal & Interest | Variable | $0 | $530 | 90% |
| Promoted | Disclosure | ||||||||||
5.49% p.a. | 5.40% p.a. | $2,836 | Principal & Interest | Variable | $0 | $0 | 80% |
| Promoted | Disclosure | ||||||||||
5.64% p.a. | 5.89% p.a. | $2,883 | Principal & Interest | Variable | $250 | $250 | 60% |
| ||||||||||||
5.64% p.a. | 5.89% p.a. | $2,883 | Principal & Interest | Variable | $248 | $350 | 60% |
|


")

Picture by Jamie Davies on Unsplash

Ready, Set, Buy!
Learn everything you need to know about buying property – from choosing the right property and home loan, to the purchasing process, tips to save money and more!
With bonus Q&A sheet and Crossword!


 Brooke Cooper
 Denise Raward