
CoreLogic's national Home Value Index released Tuesday revealed the lowest monthly growth reading in housing value since October 2020 at 0.6%, down 1.1% from results recorded in January.
CoreLogic’s Director of Research Tim Lawless said every capital city and broad ‘rest of state’ region is now recording a slowing trend in value growth, albeit with significant diversity.
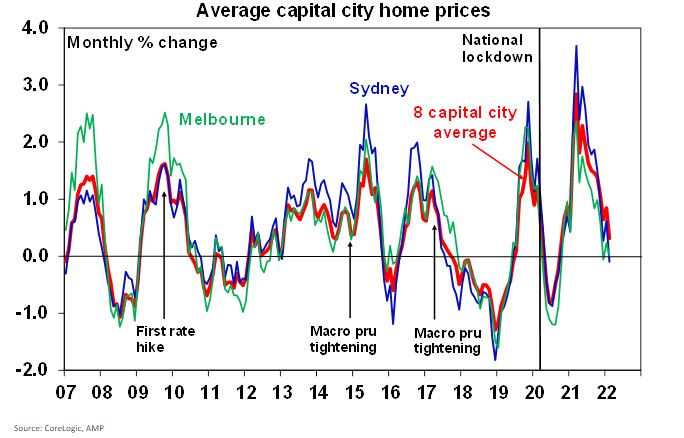
"Sydney and Melbourne have shown the sharpest slowdown with Sydney posting the first decline in housing values since September 2020 - -0.1% - while Melbourne housing values were unchanged over the month following similar results in December - -0.1% - and January, +0.2%,” Mr Lawless said.
Australian capital city housing prices are now sitting 20% above their previous record high in September 2017 and 24.6% above their recent low in September 2020.
Mr Lawless said it's important to note the slower growth conditions in Australian housing values goes well beyond the rising expectation of interest rate hikes later this year.
AMP Chief Economist Shane Oliver said this peak is reflecting the combination of poor affordability, rising mortgage rates, and the RBA likely to start hiking rates by August but possibly as early as June.
Mr Oliver said rising supply in Sydney and Melbourne is due to vendors seeking to take advantage of high prices.
"Peak property price growth is now well behind us and national average property prices are likely to peak in the next six months and then fall into 2023," Mr Oliver said.
"The property slowdown is occurring earlier relative to the timing of RBA rate hikes this cycle because of the bigger role ultra-low fixed rate mortgage lending played this time around in driving the boom.
"Normally fixed rate lending was around 15% of new home lending but over the last 18 months or so it was around 40 to 50% as borrowers took advantage of sub-2% fixed mortgage rates.
"However, fixed rates have now been rising since the June quarter last year which has been taking the edge of new home buyer demand."
Just last month one of Australia's largest bank's in ANZ, increased fixed home loan rates twice, by up to a total of 104 basis points.
Read more: How interest rates compare to a year ago
Despite a plateau across the nation, CoreLogic's report detailed regional Australia continues to record a substantially higher rate of growth than capital cities.
CoreLogic highlighted over the past three months, housing values across combined state regions increased more than three times the speed of housing values across combined capital cities at 5.7%.
However, CoreLogic notes across the regions conditions have eased from a recent peak of 6.4% over the December quarter and remains down from a cyclical peak of 6.6% recorded in April last year.
Mr Lawless pointed out regional housing markets aren’t immune from the higher cost of debt as fixed-term mortgage rates rise.
"These markets are also increasingly impacted by worsening affordability constraints as housing prices consistently outpace incomes, however demographic tailwinds, low inventory levels and ongoing demand for coastal or treechange housing options are continuing to support strong upwards price pressures across regional housing markets,” he said.
What's next for Australian property?
RBA rate rises are weighing on Australian economists' property forecasts for the next couple years.
Mr Oliver said the 30 year declining trend in mortgage rates which has enabled new buyers to borrow progressively and hence pay more and more for property is now likely over.
He also said the work from home phenomenon may take some pressure off capital city prices.
CommBank's Head of Australian Economics Gareth Aird said they expect the RBA to exhibit greater awareness of the focus between changes in interest rates and the impact on home prices, household behaviour and the broader economy.
"The economy is not static, rising interest rates will generate changes in behaviour, which in turn will impact economic outcomes," Mr Aird said.
"We expect an orderly correction in dwelling prices of 8% in 2023, with prices forecast to end 2023 a little lower given we are looking for a flat outcome nationally now in 2022."
Westpac Senior Economist Matthew Hassan said the slowing of the property market at current remains gentle to date and is coming against a backdrop of very high turnover.
"Consistent with affordability becoming a more binding constraint in many markets, we expect to see a more pronounced cooling as the year unfolds and an eventual shift into correction as official rate hikes come through from August," Mr Hassan said.
Buying a home or looking to refinance? The table below features home loans with some of the lowest interest rates on the market for owner occupiers.
| Lender | Home Loan | Interest Rate | Comparison Rate* | Monthly Repayment | Repayment type | Rate Type | Offset | Redraw | Ongoing Fees | Upfront Fees | Max LVR | Lump Sum Repayment | Extra Repayments | Split Loan Option | Tags | Features | Link | Compare | Promoted Product | Disclosure |
|---|---|---|---|---|---|---|---|---|---|---|---|---|---|---|---|---|---|---|---|---|
5.54% p.a. | 5.58% p.a. | $2,852 | Principal & Interest | Variable | $0 | $530 | 90% |
| Promoted | Disclosure | ||||||||||
5.49% p.a. | 5.40% p.a. | $2,836 | Principal & Interest | Variable | $0 | $0 | 80% |
| Promoted | Disclosure | ||||||||||
5.64% p.a. | 5.89% p.a. | $2,883 | Principal & Interest | Variable | $250 | $250 | 60% |
| Promoted | Disclosure | ||||||||||
5.64% p.a. | 5.89% p.a. | $2,883 | Principal & Interest | Variable | $248 | $350 | 60% |
| Disclosure |


")

Image by Pixabay via Pexels

Ready, Set, Buy!
Learn everything you need to know about buying property – from choosing the right property and home loan, to the purchasing process, tips to save money and more!
With bonus Q&A sheet and Crossword!


 Harry O'Sullivan
 Bea Garcia
 Denise Raward
 Rachel Horan
 William Jolly